
Page 139 - Applied statistics and probability for engineers
P. 139
Section 4-5/Continuous Uniform Distribution 117
f(x)
f(x)
1
b – a
5
a b x 4.9 4.95 5.0 5.1 x
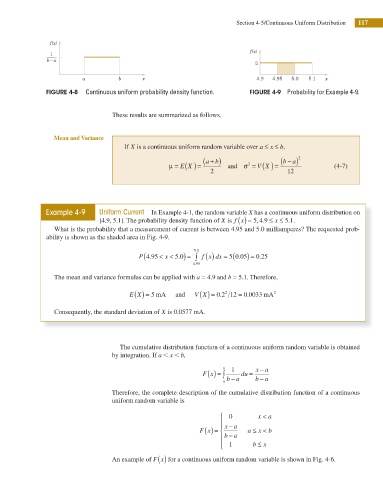
FIGURE 4-8 Continuous uniform probability density function. FIGURE 4-9 Probability for Example 4-9.
These results are summarized as follows.
Mean and Variance
If X is a continuous uniform random variable over a ≤ ≤ b,
x
2
+ ) b
(a
− ) a
(b
2
X
E
V
X
μ = ( ) = and σ = ( ) = (4-7)
2 12
Example 4-9 Uniform Current In Example 4-1, the random variable X has a continuous uniform distribution on
,
.
[4.9, 5.1]. The probability density function of X is f x ( ) = 5 4 9 ≤ x ≤ 5 1 .
.
What is the probability that a measurement of current is between 4.95 and 5.0 milliamperes? The requested prob-
ability is shown as the shaded area in Fig. 4-9.
( )
. (
5 0 05) =
P 4 95 < x < 5 0) = 5 0 . f x dx = ( . 0 25
∫
.
.
.
4 95
.
.
The mean and variance formulas can be applied with a = 4 9 and b = 5 1 . Therefore,
2
E X ( ) = 5 mA and V X ( ) = 0 2 12 = 0.0033 mA 2
.
Consequently, the standard deviation of X is 0.0577 mA.
The cumulative distribution function of a continuous uniform random variable is obtained
x
by integration. If a , , b,
−
x 1 x a
F x ( ) = ∫ du =
−
−
a b a b a
Therefore, the complete description of the cumulative distribution function of a continuous
uniform random variable is
⎧ 0 x < a
⎪ −
⎪
F x ( ) = ⎨ x a a ≤ x < b
−
⎪ b a
⎪ 1 b ≤ x
⎩
An example of F x ( ) for a continuous uniform random variable is shown in Fig. 4-6.