Page 197 - Applied statistics and probability for engineers
P. 197

Section 5-2/Covariance and Correlation     175

                              Covariance
                                                                                                             , (
                                             The covariance between the random variables X and Y, denoted as cov  X Y)
                                             or σ XY , is
                                                                  ( ⎡
                                                                                    E XY
                                                           σ XY  = E X  − μ )(Y  − μ )⎤ = ( ) − μ μ Y      (5-14)
                                                                  ⎣
                                                                                 ⎦
                                                                                             X
                                                                        X
                                                                               Y
                                         If the points in the joint probability distribution of X and Y that receive positive probability
                                         tend to fall along a line of positive (or negative) slope, σ XY , is positive (or negative). If the
                                         points tend to fall along a line of positive slope, X  tends to be greater than μ X  when Y  is
                                         greater than μ Y . Therefore, the product of the two terms x − μ X  and y − μ Y  tends to be positive.
                                         However, if the points tend to fall along a line of negative slope, x − μ X  tends to be positive
                                         when y − μ Y  is negative, and vice versa. Therefore, the product of x − μ X  and y − μ Y  tends to
                                         be negative. In this sense, the covariance between X and Y describes the variation between the
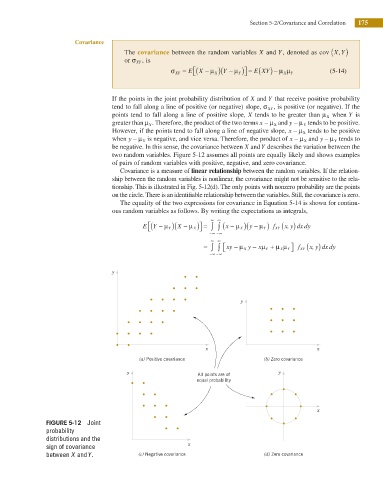
                                         two random variables. Figure 5-12 assumes all points are equally likely and shows examples
                                         of pairs of random variables with positive, negative, and zero covariance.
                                            Covariance is a measure of linear relationship between the random variables. If the relation-
                                         ship between the random variables is nonlinear, the covariance might not be sensitive to the rela-
                                         tionship. This is illustrated in Fig. 5-12(d). The only points with nonzero probability are the points
                                         on the circle. There is an identiiable relationship between the variables. Still, the covariance is zero.
                                            The equality of the two expressions for covariance in Equation 5-14 is shown for continu-
                                         ous random variables as follows. By writing the expectations as integrals,
                                                  E Y − μ )( X − μ )⎤ =  ∞ ∫  ∞  ( ∫  x − μ )( y − μ )  f XY ( x, y dx dy
                                                                                                )
                                                     ( ⎡
                                                                   ⎦
                                                    ⎣
                                                                                X
                                                          Y
                                                                  X
                                                                                       Y
                                                                      −∞ −∞
                                                                       ∞  ∞
                                                                     =  ∫  ⎡ ⎣ ∫  xy − μ X y −  xμ Y + μ μ ⎤  f XY x, y dx dy  (  )
                                                                                              Y ⎦
                                                                                            X
                                                                                 X
                                                                      −∞ −∞
                                         y
                                                                                y


                                                                     x                                 x
                                                 (a) Positive covariance               (b) Zero covariance

                                              y                    All points are of       y
                                                                   equal probability


                                                                                                       x

                     FIGURE 5-12  Joint
                     probability
                     distributions and the
                     sign of covariance                         x
                     between X and Y .           (c) Negative covariance               (d) Zero covariance
   192   193   194   195   196   197   198   199   200   201   202