
Page 259 - Applied statistics and probability for engineers
P. 259
Section 6-7/Probability Plots 237
(c) Construct a stem-and-leaf diagram of energy usage. (f) Suppose that the irst 36 observations in the table come from
(d) What proportion of the energy usage data is above the aver- one machine and the remaining come from a second machine
age usage plus 2 standard deviations? (read across the rows and the down). Does there seem to be a
possible difference in the two machines? Construct an appro-
6-127. The force needed to remove the cap from a medicine
bottle is an important feature of the product because requir- priate graphical display of the data as part of your answer.
ing too much force may cause dificulty for elderly patients (g) Plot the i rst 36 observations in the table on a normal prob-
or patients with arthritis or similar conditions. Table 6E.17 ability plot and the remaining observations on another normal
presents the results of testing a sample of 68 caps attached to probability plot. Compare the results with the single normal
bottles for the force (in pounds) required for removing the cap. probability plot that you constructed for all of the data in part (c).
(a) Construct a stem-and-leaf diagram of the force data. 6-128. Consider the global mean surface air temperature
(b) What are the average and the standard deviation of the force? anomaly and the global CO 2 concentration data originally
(c) Construct a normal probability plot of the data and com- shown in Table 6E.5.
ment on the plot. (a) Construct a scatter plot of the global mean surface air
(d) If the upper speciication on required force is 30 pounds, temperature anomaly versus the global CO concentration
2
what proportion of the caps do not meet this requirement? Comment on the plot.
(e) What proportion of the caps exceeds the average force plus (b) What is the simple correlation coefi cient between these
2 standard deviations? two variables?
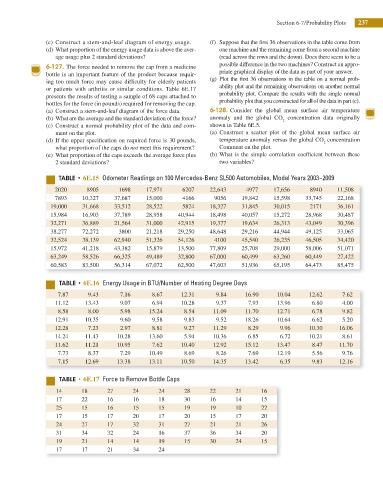
5 6E.15 Odometer Readings on 100 Mercedes-Benz SL500 Automobiles, Model Years 2003−2009
2020 8905 1698 17,971 6207 22,643 4977 17,656 8940 11,508
7893 10,327 37,687 15,000 4166 9056 19,842 15,598 33,745 22,168
19,000 31,668 33,512 28,522 5824 18,327 31,845 30,015 2171 36,161
15,984 16,903 37,789 28,958 40,944 18,498 40,057 15,272 28,968 30,487
32,271 36,889 21,564 31,000 42,915 19,377 19,634 26,313 43,049 30,396
38,277 72,272 3800 21,218 29,250 48,648 29,216 44,944 49,125 33,065
32,524 38,139 62,940 51,326 54,126 4100 45,540 26,235 46,505 34,420
15,972 41,218 43,382 15,879 13,500 77,809 25,708 29,000 58,006 51,071
63,249 58,526 66,325 49,489 32,800 67,000 60,499 63,260 60,449 27,422
60,583 83,500 56,314 67,072 62,500 47,603 51,936 65,195 64,473 85,475
5"#-& t 6E.16 Energy Usage in BTU/Number of Heating Degree Days
7.87 9.43 7.16 8.67 12.31 9.84 16.90 10.04 12.62 7.62
11.12 13.43 9.07 6.94 10.28 9.37 7.93 13.96 6.80 4.00
8.58 8.00 5.98 15.24 8.54 11.09 11.70 12.71 6.78 9.82
12.91 10.35 9.60 9.58 9.83 9.52 18.26 10.64 6.62 5.20
12.28 7.23 2.97 8.81 9.27 11.29 8.29 9.96 10.30 16.06
14.24 11.43 10.28 13.60 5.94 10.36 6.85 6.72 10.21 8.61
11.62 11.21 10.95 7.62 10.40 12.92 15.12 13.47 8.47 11.70
7.73 8.37 7.29 10.49 8.69 8.26 7.69 12.19 5.56 9.76
7.15 12.69 13.38 13.11 10.50 14.35 13.42 6.35 9.83 12.16
TABLE t 6E.17 Force to Remove Bottle Caps
14 18 27 24 24 28 22 21 16
17 22 16 16 18 30 16 14 15
25 15 16 15 15 19 19 10 22
17 15 17 20 17 20 15 17 20
24 27 17 32 31 27 21 21 26
31 34 32 24 16 37 36 34 20
19 21 14 14 19 15 30 24 15
17 17 21 34 24