
Page 26 - Applied statistics and probability for engineers
P. 26
4 Chapter 1/The Role of Statistics in Engineering
3
= inch
32
12 13 14 15 12 13 14 15 = 1 8 inch
Pull-off force Pull-off force
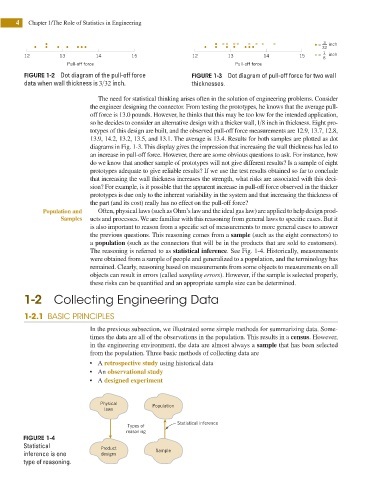
FIGURE 1-2 Dot diagram of the pull-off force FIGURE 1-3 Dot diagram of pull-off force for two wall
data when wall thickness is 3 32 inch. thicknesses.
The need for statistical thinking arises often in the solution of engineering problems. Consider
the engineer designing the connector. From testing the prototypes, he knows that the average pull-
off force is 13.0 pounds. However, he thinks that this may be too low for the intended application,
so he decides to consider an alternative design with a thicker wall, 1 8 inch in thickness. Eight pro-
totypes of this design are built, and the observed pull-off force measurements are 12.9, 13.7, 12.8,
13.9, 14.2, 13.2, 13.5, and 13.1. The average is 13.4. Results for both samples are plotted as dot
diagrams in Fig. 1-3. This display gives the impression that increasing the wall thickness has led to
an increase in pull-off force. However, there are some obvious questions to ask. For instance, how
do we know that another sample of prototypes will not give different results? Is a sample of eight
prototypes adequate to give reliable results? If we use the test results obtained so far to conclude
that increasing the wall thickness increases the strength, what risks are associated with this deci-
sion? For example, is it possible that the apparent increase in pull-off force observed in the thicker
prototypes is due only to the inherent variability in the system and that increasing the thickness of
the part (and its cost) really has no effect on the pull-off force?
Population and Often, physical laws (such as Ohm’s law and the ideal gas law) are applied to help design prod-
Samples ucts and processes. We are familiar with this reasoning from general laws to speciic cases. But it
is also important to reason from a speciic set of measurements to more general cases to answer
the previous questions. This reasoning comes from a sample (such as the eight connectors) to
a population (such as the connectors that will be in the products that are sold to customers).
The reasoning is referred to as statistical inference. See Fig. 1-4. Historically, measurements
were obtained from a sample of people and generalized to a population, and the terminology has
remained. Clearly, reasoning based on measurements from some objects to measurements on all
objects can result in errors (called sampling errors). However, if the sample is selected properly,
these risks can be quantiied and an appropriate sample size can be determined.
1-2 Collecting Engineering Data
1-2.1 BASIC PRINCIPLES
In the previous subsection, we illustrated some simple methods for summarizing data. Some-
times the data are all of the observations in the population. This results in a census. However,
in the engineering environment, the data are almost always a sample that has been selected
from the population. Three basic methods of collecting data are
r A retrospective study using historical data
r An observational study
r A designed experiment
Physical Population
laws
Statistical inference
Types of
reasoning
FIGURE 1-4
Statistical Product
inference is one designs Sample
type of reasoning.