
Page 30 - Applied statistics and probability for engineers
P. 30
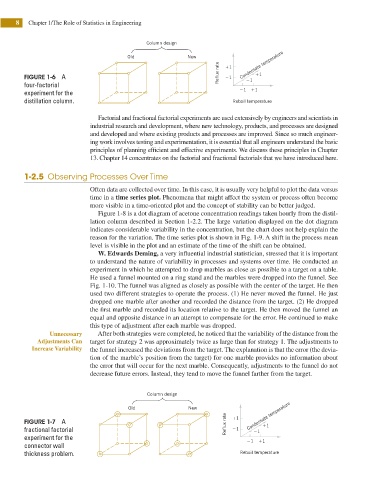
8   Chapter 1/The Role of Statistics in Engineering


                                                    Column design
                                              Old               New             Condensate temperature
                                                                         Reflux rate  11  11
               FIGURE 1-6 A                                                21    21
               four-factorial
                                                                               21  11
               experiment for the
               distillation column.                                          Reboil temperature

                                     Factorial and fractional factorial experiments are used extensively by engineers and scientists in
                                   industrial research and development, where new technology, products, and processes are designed
                                   and developed and where existing products and processes are improved. Since so much engineer-
                                   ing work involves testing and experimentation, it is essential that all engineers understand the basic
                                   principles of planning eficient and effective experiments. We discuss these principles in Chapter
                                   13. Chapter 14 concentrates on the factorial and fractional factorials that we have introduced here.

               1-2.5 Observing Processes Over Time

                                   Often data are collected over time. In this case, it is usually very helpful to plot the data versus
                                   time in a time series plot. Phenomena that might affect the system or process often become
                                   more visible in a time-oriented plot and the concept of stability can be better judged.
                                     Figure 1-8 is a dot diagram of acetone concentration readings taken hourly from the distil-
                                   lation column described in Section 1-2.2. The large variation displayed on the dot diagram
                                   indicates considerable variability in the concentration, but the chart does not help explain the
                                   reason for the variation. The time series plot is shown in Fig. 1-9. A shift in the process mean
                                   level is visible in the plot and an estimate of the time of the shift can be obtained.
                                     W. Edwards Deming, a very inluential industrial statistician, stressed that it is important
                                   to understand the nature of variability in processes and systems over time. He conducted an
                                   experiment in which he attempted to drop marbles as close as possible to a target on a table.
                                   He used a funnel mounted on a ring stand and the marbles were dropped into the funnel. See
                                   Fig. 1-10. The funnel was aligned as closely as possible with the center of the target. He then
                                   used two different strategies to operate the process. (1) He never moved the funnel. He just
                                   dropped one marble after another and recorded the distance from the target. (2) He dropped
                                   the irst marble and recorded its location relative to the target. He then moved the funnel an
                                   equal and opposite distance in an attempt to compensate for the error. He continued to make
                                   this type of adjustment after each marble was dropped.
                       Unnecessary   After both strategies were completed, he noticed that the variability of the distance from the
                   Adjustments Can   target for strategy 2 was approximately twice as large than for strategy 1. The adjustments to
                 Increase Variability  the funnel increased the deviations from the target. The explanation is that the error (the devia-
                                   tion of the marble’s position from the target) for one marble provides no information about
                                   the error that will occur for the next marble. Consequently, adjustments to the funnel do not
                                   decrease future errors. Instead, they tend to move the funnel farther from the target.

                                                    Column design

                                              Old               New
                                                                           Reflux rate  11
               FIGURE 1-7 A                                                  11   Condensate temperature
               fractional factorial                                          21     21
               experiment for the
                                                                                  21  11
               connector wall
               thickness problem.                                               Reboil temperature