
Page 33 - Applied statistics and probability for engineers
P. 33
Section 1-3/Mechanistic and Empirical Models 11
100
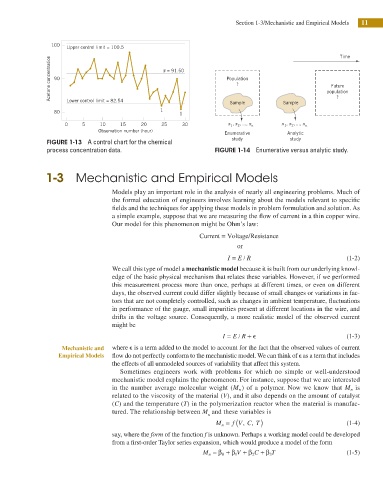
Upper control limit = 100.5 Time
Acetone concentration 90 x = 91.50 Population population
?
Future
80 Lower control limit = 82.54 1 1 Sample Sample ?
0 5 10 15 20 25 30 x , x ,…, x x , x ,…, x
1
1
2
2
n
n
Observation number (hour) Enumerative Analytic
study study
FIGURE 1-13 A control chart for the chemical
process concentration data. FIGURE 1-14 Enumerative versus analytic study.
1-3 Mechanistic and Empirical Models
Models play an important role in the analysis of nearly all engineering problems. Much of
the formal education of engineers involves learning about the models relevant to speciic
ields and the techniques for applying these models in problem formulation and solution. As
a simple example, suppose that we are measuring the low of current in a thin copper wire.
Our model for this phenomenon might be Ohm’s law:
Current = Voltage/Resistance
or
/
I = E R (1-2)
We call this type of model a mechanistic model because it is built from our underlying knowl-
edge of the basic physical mechanism that relates these variables. However, if we performed
this measurement process more than once, perhaps at different times, or even on different
days, the observed current could differ slightly because of small changes or variations in fac-
tors that are not completely controlled, such as changes in ambient temperature, luctuations
in performance of the gauge, small impurities present at different locations in the wire, and
drifts in the voltage source. Consequently, a more realistic model of the observed current
might be
/
I = E R + e (1-3)
Mechanistic and where e is a term added to the model to account for the fact that the observed values of current
Empirical Models low do not perfectly conform to the mechanistic model. We can think of e as a term that includes
the effects of all unmodeled sources of variability that affect this system.
Sometimes engineers work with problems for which no simple or well-understood
mechanistic model explains the phenomenon. For instance, suppose that we are interested
is
in the number average molecular weight (M n ) of a polymer. Now we know that M n
related to the viscosity of the material (V), and it also depends on the amount of catalyst
(C) and the temperature (T) in the polymerization reactor when the material is manufac-
tured. The relationship between M and these variables is
n
(
,
,
M n = f V C T) (1-4)
say, where the form of the function f is unknown. Perhaps a working model could be developed
from a irst-order Taylor series expansion, which would produce a model of the form
T
M n = β + β 1 V + β 2 C + β 3 (1-5)
0