
Page 32 - Applied statistics and probability for engineers
P. 32
10 Chapter 1/The Role of Statistics in Engineering
16
14
12
10
y
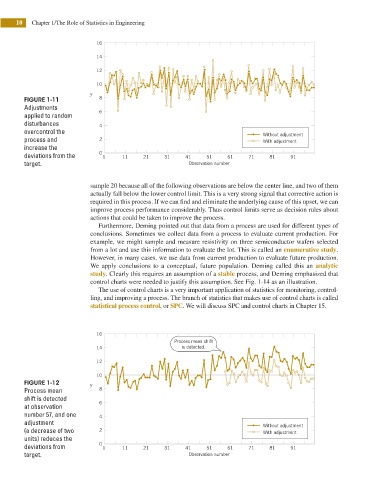
FIGURE 1-11 8
Adjustments
6
applied to random
disturbances 4
overcontrol the Without adjustment
process and 2 With adjustment
increase the
0
deviations from the 1 11 21 31 41 51 61 71 81 91
target. Observation number
sample 20 because all of the following observations are below the center line, and two of them
actually fall below the lower control limit. This is a very strong signal that corrective action is
required in this process. If we can ind and eliminate the underlying cause of this upset, we can
improve process performance considerably. Thus control limits serve as decision rules about
actions that could be taken to improve the process.
Furthermore, Deming pointed out that data from a process are used for different types of
conclusions. Sometimes we collect data from a process to evaluate current production. For
example, we might sample and measure resistivity on three semiconductor wafers selected
from a lot and use this information to evaluate the lot. This is called an enumerative study.
However, in many cases, we use data from current production to evaluate future production.
We apply conclusions to a conceptual, future population. Deming called this an analytic
study. Clearly this requires an assumption of a stable process, and Deming emphasized that
control charts were needed to justify this assumption. See Fig. 1-14 as an illustration.
The use of control charts is a very important application of statistics for monitoring, control-
ling, and improving a process. The branch of statistics that makes use of control charts is called
statistical process control, or SPC. We will discuss SPC and control charts in Chapter 15.
16
Process mean shift
14 is detected.
12
10
FIGURE 1-12 y
Process mean 8
shift is detected 6
at observation
number 57, and one 4
adjustment Without adjustment
(a decrease of two 2 With adjustment
units) reduces the
deviations from 0 1 11 21 31 41 51 61 71 81 91
target. Observation number