Page 35 - Applied statistics and probability for engineers
P. 35

Section 1-4/Probability and Probability Models     13


                                             5"#-& t 1-2  Wire Bond Pull Strength Data

                                          Observation Number  Pull Strength y  Wire Length x 1   Die Height x 2
                                                   1               9.95              2              50
                                                   2              24.45              8             110
                                                   3              31.75             11             120
                                                   4              35.00             10             550
                                                   5              25.02              8             295
                                                   6              16.86              4             200
                                                   7              14.38              2             375
                                                   8               9.60              2              52
                                                   9              24.35              9             100
                                                  10              27.50              8             300
                                                  11              17.08              4             412
                                                  12              37.00             11             400
                                                  13              41.95             12             500
                                                  14              11.66              2             360
                                                  15              21.65              4             205
                                                  16              17.89              4             400
                                                  17              69.00             20             600
                                                  18              10.30              1             585
                                                  19              34.93             10             540
                                                  20              46.59             15             250
                                                  21              44.88             15             290
                                                  22              54.12             16             510
                                                  23              56.63             17             590
                                                  24              22.13              6             100
                                                  25              21.15              5             400


                                         conclusions for a population of objects was referred to as statistical inference. A sample of three
                                         wafers selected from a large production lot of wafers in semiconductor manufacturing was an
                                         example mentioned. To make good decisions, an analysis of how well a sample represents a pop-
                                         ulation is clearly necessary. If the lot contains defective wafers, how well will the sample detect
                                         these defective items? How can we quantify the criterion to “detect well?” Basically, how can we
                                         quantify the risks of decisions based on samples? Furthermore, how should samples be selected
                                         to provide good decisions—ones with acceptable risks? Probability models help quantify the
                                         risks involved in statistical inference, that is, the risks involved in decisions made every day.

                                            80
                                           Pull strength  60

                                            40
                                                                                     600
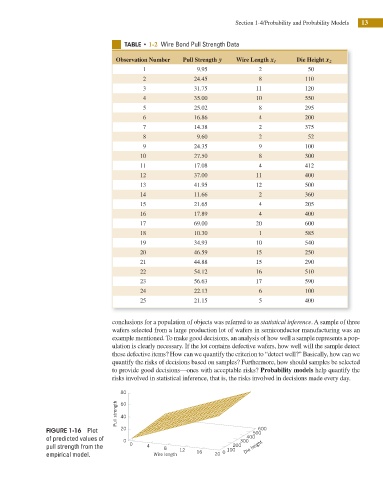
                     FIGURE 1-16  Plot      20                                     500
                     of predicted values of   0                                 300 400
                     pull strength from the   0     4    8   12             100 200  Die height
                     empirical model.                 Wire length  16   20  0
   30   31   32   33   34   35   36   37   38   39   40