
Page 193 - Applied Statistics Using SPSS, STATISTICA, MATLAB and R
P. 193
174 5 Non-Parametric Tests of Hypotheses
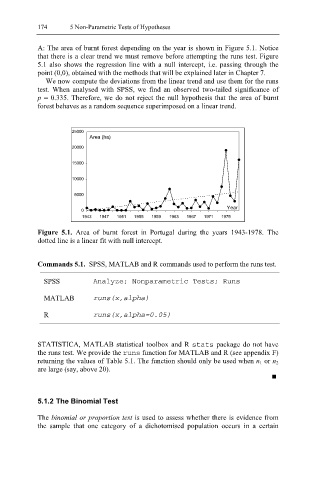
A: The area of burnt forest depending on the year is shown in Figure 5.1. Notice
that there is a clear trend we must remove before attempting the runs test. Figure
5.1 also shows the regression line with a null intercept, i.e. passing through the
point (0,0), obtained with the methods that will be explained later in Chapter 7.
We now compute the deviations from the linear trend and use them for the runs
test. When analysed with SPSS, we find an observed two-tailed significance of
p = 0.335. Therefore, we do not reject the null hypothesis that the area of burnt
forest behaves as a random sequence superimposed on a linear trend.
25000
Area (ha)
20000
15000
10000
5000
Year
0
1943 1947 1951 1955 1959 1963 1967 1971 1975
Figure 5.1. Area of burnt forest in Portugal during the years 1943-1978. The
dotted line is a linear fit with null intercept.
Commands 5.1. SPSS, MATLAB and R commands used to perform the runs test.
SPSS Analyze; Nonparametric Tests; Runs
MATLAB runs(x,alpha)
R runs(x,alpha=0.05)
STATISTICA, MATLAB statistical toolbox and R stat s package do not have
the runs test. We provide the runs function for MATLAB and R (see appendix F)
returning the values of Table 5.1. The function should only be used when n 1 or n 2
are large (say, above 20).
5.1.2 The Binomial Test
The binomial or proportion test is used to assess whether there is evidence from
the sample that one category of a dichotomised population occurs in a certain