
Page 195 - Applied Statistics Using SPSS, STATISTICA, MATLAB and R
P. 195
176 5 Non-Parametric Tests of Hypotheses
Example 5.3
Q: According to Mendel’s Heredity Theory, a cross breeding of yellow and green
peas should produce them in a proportion of three times more yellow peas than
green peas. A cross breeding of yellow and green peas was performed and
produced 176 yellow peas and 48 green peas. Are these experimental results
explainable by the Theory?
A: Given the theoretically expected values of the proportion of yellow peas, the
test is formalised as:
H 0: P(ω =1) = ¾ ;
H 1: P(ω =1) ≠ ¾.
In order to apply the binomial test to this example, using SPSS, we start by
filling in a datasheet as shown in Table 5.2.
Next, in order to specify that category 1 of pea-type occurs 176 times and the
category 0 occurs 48 times, we use the “weight cases” option of SPSS, as shown in
Commands 5.2. In the Weight Cases window we specify that the weight
variable is n.
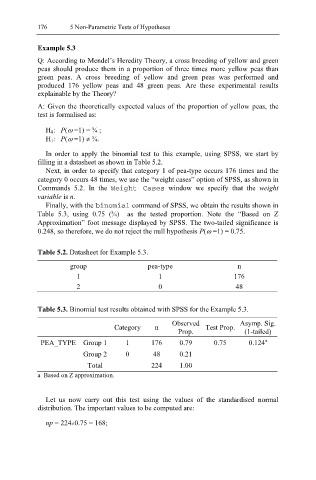
Finally, with the binomial command of SPSS, we obtain the results shown in
Table 5.3, using 0.75 (¾) as the tested proportion. Note the “Based on Z
Approximation” foot message displayed by SPSS. The two-tailed significance is
0.248, so therefore, we do not reject the null hypothesis P(ω =1) = 0.75.
Table 5.2. Datasheet for Example 5.3.
group pea-type n
1 1 176
2 0 48
Table 5.3. Binomial test results obtained with SPSS for the Example 5.3.
Observed Asymp. Sig.
Category n Test Prop.
Prop. (1-tailed)
a
PEA_TYPE Group 1 1 176 0.79 0.75 0.124
Group 2 0 48 0.21
Total 224 1.00
a Based on Z approximation.
Let us now carry out this test using the values of the standardised normal
distribution. The important values to be computed are:
np = 224×0.75 = 168;