
Page 200 - Applied Statistics Using SPSS, STATISTICA, MATLAB and R
P. 200
5.1 Inference on One Population 181
Does the Fr eshmen dataset confirm that belief for the Porto Engineering
College?
A: We use the categories of answers obtained for Question 6, “I felt compelled to
participate in the Initiation”, of the freshmen dataset (see Appendix E). The
respective EXCEL file contains the computations of the frequencies of occurrence
of each category and for each question, assuming a specified threshold for the
average results in the examinations. Using, for instance, the threshold = 10, we see
that there are 102 “best” students, with average examination score not less than the
threshold. From these 102, there are varied counts for the five categories of
Question 6, ranging from 16 students that “fully disagree” to 5 students that “fully
agree”.
Under the null hypothesis, the answers to Question 6 have no relation with the
freshmen performance and we would expect equal frequencies for all categories.
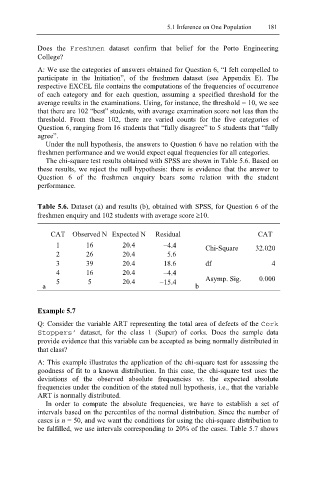
The chi-square test results obtained with SPSS are shown in Table 5.6. Based on
these results, we reject the null hypothesis: there is evidence that the answer to
Question 6 of the freshmen enquiry bears some relation with the student
performance.
Table 5.6. Dataset (a) and results (b), obtained with SPSS, for Question 6 of the
freshmen enquiry and 102 students with average score ≥10.
CAT Observed N Expected N Residual CAT
1 16 20.4 −4.4 Chi-Square 32.020
2 26 20.4 5.6
3 39 20.4 18.6 df 4
4 16 20.4 −4.4
5 5 20.4 −15.4 Asymp. Sig. 0.000
a b
Example 5.7
Q: Consider the variable ART representing the total area of defects of the Cork
Stoppers’ dataset, for the class 1 (Super) of corks. Does the sample data
provide evidence that this variable can be accepted as being normally distributed in
that class?
A: This example illustrates the application of the chi-square test for assessing the
goodness of fit to a known distribution. In this case, the chi-square test uses the
deviations of the observed absolute frequencies vs. the expected absolute
frequencies under the condition of the stated null hypothesis, i.e., that the variable
ART is normally distributed.
In order to compute the absolute frequencies, we have to establish a set of
intervals based on the percentiles of the normal distribution. Since the number of
cases is n = 50, and we want the conditions for using the chi-square distribution to
be fulfilled, we use intervals corresponding to 20% of the cases. Table 5.7 shows