
Page 236 - Applied Statistics Using SPSS, STATISTICA, MATLAB and R
P. 236
5.4 Inference on More Than Two Populations 217
ranks 4 and 5; thus they get the average rank 4.5. Table 5.29 lists the results of the
Friedman test, obtained with SPSS. Based on these results, the null hypothesis is
rejected at 5% level (or even at a smaller level).
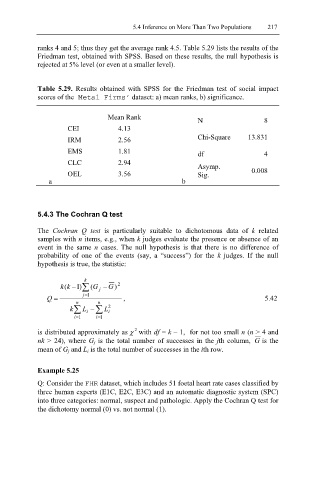
Table 5.29. Results obtained with SPSS for the Friedman test of social impact
scores of the Metal Firms’ dataset: a) mean ranks, b) significance.
Mean Rank N 8
CEI 4.13
IRM 2.56 Chi-Square 13.831
EMS 1.81 df 4
CLC 2.94
Asymp.
OEL 3.56 Sig. 0.008
a b
5.4.3 The Cochran Q test
The Cochran Q test is particularly suitable to dichotomous data of k related
samples with n items, e.g., when k judges evaluate the presence or absence of an
event in the same n cases. The null hypothesis is that there is no difference of
probability of one of the events (say, a “success”) for the k judges. If the null
hypothesis is true, the statistic:
k
k( k − )1 ∑ ( G j −G ) 2
Q = n = j 1 n , 5.42
k ∑ L i − ∑ L 2 i
= i 1
= i 1
2
is distributed approximately as χ with df = k – 1, for not too small n (n > 4 and
nk > 24), where G j is the total number of successes in the jth column, G is the
mean of G j and L i is the total number of successes in the ith row.
Example 5.25
Q: Consider the FHR dataset, which includes 51 foetal heart rate cases classified by
three human experts (E1C, E2C, E3C) and an automatic diagnostic system (SPC)
into three categories: normal, suspect and pathologic. Apply the Cochran Q test for
the dichotomy normal (0) vs. not normal (1).