
Page 232 - Applied Statistics Using SPSS, STATISTICA, MATLAB and R
P. 232
5.4 Inference on More Than Two Populations 213
g
)N −
1 − ∑ ( i 3 t / ( t − 3 N , 5.39
)
i
i =1
where t i is the number of ties in group i of g tied groups, and N is the total number
of cases in the c samples (sum of the n i).
The power-efficiency of the Kruskal-Wallis test, referred to the one-way
ANOVA, is asymptotically 95.5%.
Example 5.21
Q: Consider the Clays’ dataset (see Appendix E). Assume that at a certain stage
of the data collection process, only the first 15 cases were available and the
Kruskal-Wallis test was used to assess which clay features best discriminated the
three types of clays (variable AGE). Perform this test and analyse its results for the
alumina content (Al 2O 3) measured with only 3 significant digits.
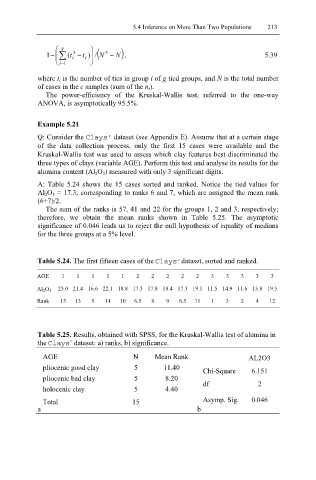
A: Table 5.24 shows the 15 cases sorted and ranked. Notice the tied values for
Al 2O 3 = 17.3, corresponding to ranks 6 and 7, which are assigned the mean rank
(6+7)/2.
The sum of the ranks is 57, 41 and 22 for the groups 1, 2 and 3, respectively;
therefore, we obtain the mean ranks shown in Table 5.25. The asymptotic
significance of 0.046 leads us to reject the null hypothesis of equality of medians
for the three groups at a 5% level.
Table 5.24. The first fifteen cases of the Clays’ dataset, sorted and ranked.
AGE 1 1 1 1 1 2 2 2 2 2 3 3 3 3 3
Al 2 O 3 23.0 21.4 16.6 22.1 18.8 17.3 17.8 18.4 17.3 19.1 11.5 14.9 11.6 15.8 19.5
Rank 15 13 5 14 10 6.5 8 9 6.5 11 1 3 2 4 12
Table 5.25. Results, obtained with SPSS, for the Kruskal-Wallis test of alumina in
the Clays’ dataset: a) ranks, b) significance.
AGE N Mean Rank AL2O3
pliocenic good clay 5 11.40
Chi-Square 6.151
pliocenic bad clay 5 8.20
df 2
holocenic clay 5 4.40
Total 15 Asymp. Sig. 0.046
a b