
Page 237 - Applied Statistics Using SPSS, STATISTICA, MATLAB and R
P. 237
218 5 Non-Parametric Tests of Hypotheses
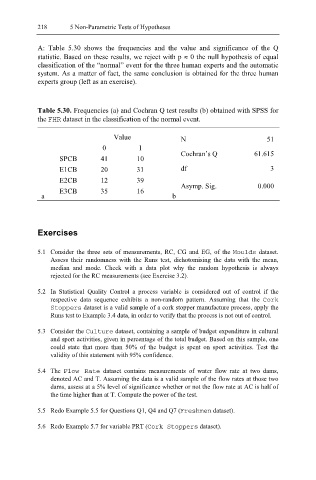
A: Table 5.30 shows the frequencies and the value and significance of the Q
statistic. Based on these results, we reject with p ≈ 0 the null hypothesis of equal
classification of the “normal” event for the three human experts and the automatic
system. As a matter of fact, the same conclusion is obtained for the three human
experts group (left as an exercise).
Table 5.30. Frequencies (a) and Cochran Q test results (b) obtained with SPSS for
the FHR dataset in the classification of the normal event.
Value N 51
0 1
Cochran’s Q 61.615
SPCB 41 10
E1CB 20 31 df 3
E2CB 12 39
Asymp. Sig. 0.000
E3CB 35 16
a b
Exercises
5.1 Consider the three sets of measurements, RC, CG and EG, of the Moulds dataset.
Assess their randomness with the Runs test, dichotomising the data with the mean,
median and mode. Check with a data plot why the random hypothesis is always
rejected for the RC measurements (see Exercise 3.2).
5.2 In Statistical Quality Control a process variable is considered out of control if the
respective data sequence exhibits a non-random pattern. Assuming that the Cork
Stoppers dataset is a valid sample of a cork stopper manufacture process, apply the
Runs test to Example 3.4 data, in order to verify that the process is not out of control.
5.3 Consider the Cu lture dataset, containing a sample of budget expenditure in cultural
and sport activities, given in percentage of the total budget. Based on this sample, one
could state that more than 50% of the budget is spent on sport activities. Test the
validity of this statement with 95% confidence.
5.4 The Flow Ra te dataset contains measurements of water flow rate at two dams,
denoted AC and T. Assuming the data is a valid sample of the flow rates at those two
dams, assess at a 5% level of significance whether or not the flow rate at AC is half of
the time higher than at T. Compute the power of the test.
5.5 Redo Example 5.5 for Questions Q1, Q4 and Q7 ( Freshmen dataset).
5.6 Redo Example 5.7 for variable PRT ( ppers Cork Sto dataset).