
Page 234 - Applied Statistics Using SPSS, STATISTICA, MATLAB and R
P. 234
5.4 Inference on More Than Two Populations 215
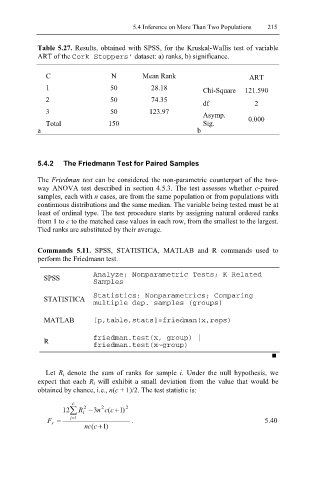
Table 5.27. Results, obtained with SPSS, for the Kruskal-Wallis test of variable
ART of the Cork Stoppers’ dataset: a) ranks, b) significance.
C N Mean Rank ART
1 50 28.18 Chi-Square 121.590
2 50 74.35
df 2
3 50 123.97
Asymp.
Total 150 Sig. 0.000
a b
5.4.2 The Friedmann Test for Paired Samples
The Friedman test can be considered the non-parametric counterpart of the two-
way ANOVA test described in section 4.5.3. The test assesses whether c-paired
samples, each with n cases, are from the same population or from populations with
continuous distributions and the same median. The variable being tested must be at
least of ordinal type. The test procedure starts by assigning natural ordered ranks
from 1 to c to the matched case values in each row, from the smallest to the largest.
Tied ranks are substituted by their average.
Commands 5.11. SPSS, STATISTICA, MATLAB and R commands used to
perform the Friedmann test.
SPSS Analyze; Nonparametric Tests; K Related
Samples
STATISTICA Statistics; Nonparametrics; Comparing
multiple dep. samples (groups)
MATLAB [p,table,stats]=friedman(x,reps)
R friedman.test(x, group) |
friedman.test(x~group)
Let R i denote the sum of ranks for sample i. Under the null hypothesis, we
expect that each R i will exhibit a small deviation from the value that would be
obtained by chance, i.e., n(c + 1)/2. The test statistic is:
c
c
12∑ R i 2 − 3n 2 c ( + ) 1 2
F r = 1 = i . 5.40
nc ( + ) 1
c