
Page 230 - Applied Statistics Using SPSS, STATISTICA, MATLAB and R
P. 230
5.3 Inference on Two Populations 211
Example 5.19
Q: Redo the two-sample comparison of Example 5.18, using the Wilcoxon signed
ranks test.
A: The Wilcoxon test results obtained with SPSS are shown in Table 5.23. At a 5%
significance level, we reject the null hypothesis of equal measurement performance
of the automatic system and the “average” human expert. Note that the conclusion
is different from the one reached using the sign test in Example 5.18.
In R the command wilcox.test(SPB, AEB, paired = TRUE) yields
the same “p-value”.
Example 5.20
Q: Estimate the power of the Wilcoxon test performed in Example 5.19 and the
needed value of n for reaching a power of at least 90%.
A: We estimate the power of the Wilcoxon test using the concept of power-
efficiency (see formula 5.1). Since Example 5.19 involves a large sample (n = 51),
the power-efficiency of the Wilcoxon test is of about 95.5%.
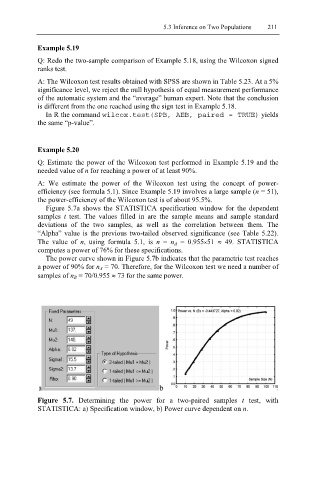
Figure 5.7a shows the STATISTICA specification window for the dependent
samples t test. The values filled in are the sample means and sample standard
deviations of the two samples, as well as the correlation between them. The
“Alpha” value is the previous two-tailed observed significance (see Table 5.22).
The value of n, using formula 5.1, is n = n A = 0.955×51 ≈ 49. STATISTICA
computes a power of 76% for these specifications.
The power curve shown in Figure 5.7b indicates that the parametric test reaches
a power of 90% for n A = 70. Therefore, for the Wilcoxon test we need a number of
samples of n B = 70/0.955 ≈ 73 for the same power.
Figure 5.7. Determining the power for a two-paired samples t test, with
STATISTICA: a) Specification window, b) Power curve dependent on n.