
Page 233 - Applied Statistics Using SPSS, STATISTICA, MATLAB and R
P. 233
214 5 Non-Parametric Tests of Hypotheses
Example 5.22
Q: Consider the Freshme n dataset and use the Kruskal-Wallis test in order to
assess whether the freshmen performance (EXAMAVG) differs according to their
attitude towards skipping the Initiation (Question 8).
A: The mean ranks and results of the test are shown in Table 5.26. Based on the
observed asymptotic significance, we reject the null hypothesis at a 5% level, i.e.,
we have evidence that the freshmen answer Question 8 of the enquiry differently,
depending on their average performance on the examinations.
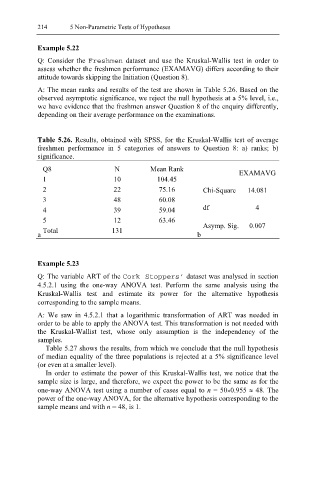
Table 5.26. Results, obtained with SPSS, for the Kruskal-Wallis test of average
freshmen performance in 5 categories of answers to Question 8: a) ranks; b)
significance.
Q8 N Mean Rank EXAMAVG
1 10 104.45
2 22 75.16 Chi-Square 14.081
3 48 60.08
4 39 59.04 df 4
5 12 63.46 Asymp. Sig. 0.007
Total 131
a b
Example 5.23
Q: The variable ART of the Cork Stoppers’ dataset was analysed in section
4.5.2.1 using the one-way ANOVA test. Perform the same analysis using the
Kruskal-Wallis test and estimate its power for the alternative hypothesis
corresponding to the sample means.
A: We saw in 4.5.2.1 that a logarithmic transformation of ART was needed in
order to be able to apply the ANOVA test. This transformation is not needed with
the Kruskal-Wallist test, whose only assumption is the independency of the
samples.
Table 5.27 shows the results, from which we conclude that the null hypothesis
of median equality of the three populations is rejected at a 5% significance level
(or even at a smaller level).
In order to estimate the power of this Kruskal-Wallis test, we notice that the
sample size is large, and therefore, we expect the power to be the same as for the
one-way ANOVA test using a number of cases equal to n = 50×0.955 ≈ 48. The
power of the one-way ANOVA, for the alternative hypothesis corresponding to the
sample means and with n = 48, is 1.