
Page 228 - Applied Statistics Using SPSS, STATISTICA, MATLAB and R
P. 228
5.3 Inference on Two Populations 209
Let us now determine the Type II Error for the alternative hypothesis “positive
differences occur three times more often than negative differences”. In this case,
the distributions of MC and MA are not identical; the distribution of MC favours
higher ranks than the distribution of MA. Figure 5.6c shows the binomial
distribution for this situation, with p = P(MC < MA) = ¼. We clearly see that, in
this case, the probability of obtaining at most 3 negative differences MC – MA
increases. The Type II Error for the critical value k = 1 is the sum of all
probabilities for k ≥ 2, which amounts to β = 0.56. Even if we relax the α level to
0.23 for a critical value k = 2, we still obtain a high Type II Error, β = 0.24. This
low power of the binomial test, already mentioned in 5.1.2, renders the conclusions
for small sample sizes quite uncertain.
Example 5.18
Q: Consider the FHR dataset containing measurements of basal heart rate
frequency (beats per minute) made on 51 foetuses (see Appendix E). Use the sign
test in order to assess whether the measurements performed by an automatic
system (SPB) are comparable to the computed average (denoted AEB) of the
measurements performed by three human experts.
A: There is a clear lack of fit of the distributions of SPB and AEB to the normal
distribution. A non-parametric test has, therefore, to be used here. The sign test
results, obtained with STATISTICA are shown in Table 5.22. At a 5% significance
level, we do not reject the null hypothesis of equal measurement performance of
the automatic system and the “average” human expert.
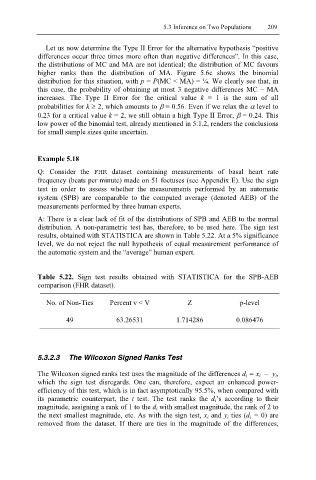
Table 5.22. Sign test results obtained with STATISTICA for the SPB-AEB
comparison (FHR dataset).
No. of Non-Ties Percent v < V Z p-level
49 63.26531 1.714286 0.086476
5.3.2.3 The Wilcoxon Signed Ranks Test
The Wilcoxon signed ranks test uses the magnitude of the differences d i = x i – y i,
which the sign test disregards. One can, therefore, expect an enhanced power-
efficiency of this test, which is in fact asymptotically 95.5%, when compared with
its parametric counterpart, the t test. The test ranks the d i’s according to their
magnitude, assigning a rank of 1 to the d i with smallest magnitude, the rank of 2 to
the next smallest magnitude, etc. As with the sign test, x i and y i ties (d i = 0) are
removed from the dataset. If there are ties in the magnitude of the differences,