
Page 223 - Applied Statistics Using SPSS, STATISTICA, MATLAB and R
P. 223
204 5 Non-Parametric Tests of Hypotheses
cases, it was even shown that the Mann-Whitney test is more powerful than the t
test! There is also evidence that it should be preferred over the previous
Kolmogorov-Smirnov test for large samples.
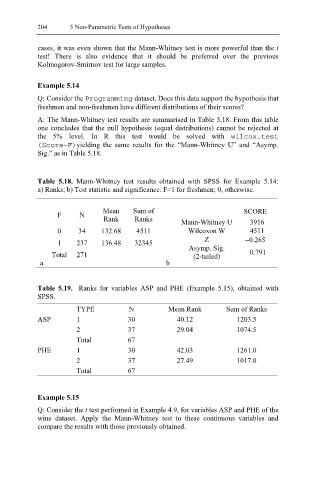
Example 5.14
Q: Consider the Programming dataset. Does this data support the hypothesis that
freshmen and non-freshmen have different distributions of their scores?
A: The Mann-Whitney test results are summarised in Table 5.18. From this table
one concludes that the null hypothesis (equal distributions) cannot be rejected at
the 5% level. In R this test would be solved with wilcox.test
(Score~F)yielding the same results for the “Mann-Whitney U” and “Asymp.
Sig.” as in Table 5.18.
Table 5.18. Mann-Whitney test results obtained with SPSS for Example 5.14:
a) Ranks; b) Test statistic and significance. F=1 for freshmen; 0, otherwise.
Mean Sum of SCORE
F N
Rank Ranks Mann-Whitney U 3916
0 34 132.68 4511 Wilcoxon W 4511
1 237 136.48 32345 Z −0.265
Asymp. Sig.
Total 271 (2-tailed) 0.791
a b
Table 5.19. Ranks for variables ASP and PHE (Example 5.15), obtained with
SPSS.
TYPE N Mean Rank Sum of Ranks
ASP 1 30 40.12 1203.5
2 37 29.04 1074.5
Total 67
PHE 1 30 42.03 1261.0
2 37 27.49 1017.0
Total 67
Example 5.15
Q: Consider the t test performed in Example 4.9, for variables ASP and PHE of the
wine dataset. Apply the Mann-Whitney test to these continuous variables and
compare the results with those previously obtained.