
Page 218 - Applied Statistics Using SPSS, STATISTICA, MATLAB and R
P. 218
5.2 Contingency Tables 199
very low, leading to the conclusion that there is an association between both
variables (PERF, PROG).
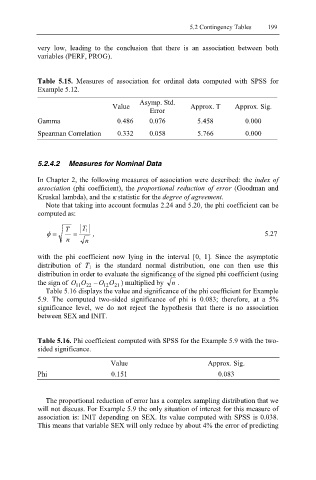
Table 5.15. Measures of association for ordinal data computed with SPSS for
Example 5.12.
Asymp. Std.
Value Approx. T Approx. Sig.
Error
Gamma 0.486 0.076 5.458 0.000
Spearman Correlation 0.332 0.058 5.766 0.000
5.2.4.2 Measures for Nominal Data
In Chapter 2, the following measures of association were described: the index of
association (phi coefficient), the proportional reduction of error (Goodman and
Kruskal lambda), and the κ statistic for the degree of agreement.
Note that taking into account formulas 2.24 and 5.20, the phi coefficient can be
computed as:
T T 1
φ = = , 5.27
n n
with the phi coefficient now lying in the interval [0, 1]. Since the asymptotic
distribution of T 1 is the standard normal distribution, one can then use this
distribution in order to evaluate the significance of the signed phi coefficient (using
the sign of O 11 O 22 − O 12 O ) multiplied by n .
21
Table 5.16 displays the value and significance of the phi coefficient for Example
5.9. The computed two-sided significance of phi is 0.083; therefore, at a 5%
significance level, we do not reject the hypothesis that there is no association
between SEX and INIT.
Table 5.16. Phi coefficient computed with SPSS for the Example 5.9 with the two-
sided significance.
Value Approx. Sig.
Phi 0.151 0.083
The proportional reduction of error has a complex sampling distribution that we
will not discuss. For Example 5.9 the only situation of interest for this measure of
association is: INIT depending on SEX. Its value computed with SPSS is 0.038.
This means that variable SEX will only reduce by about 4% the error of predicting