
Page 214 - Applied Statistics Using SPSS, STATISTICA, MATLAB and R
P. 214
5.2 Contingency Tables 195
male and female students have different behaviour participating in the “initiation”
on their own will?
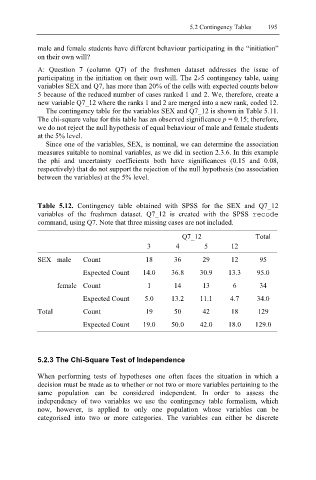
A: Question 7 (column Q7) of the freshmen dataset addresses the issue of
participating in the initiation on their own will. The 2×5 contingency table, using
variables SEX and Q7, has more than 20% of the cells with expected counts below
5 because of the reduced number of cases ranked 1 and 2. We, therefore, create a
new variable Q7_12 where the ranks 1 and 2 are merged into a new rank, coded 12.
The contingency table for the variables SEX and Q7_12 is shown in Table 5.11.
The chi-square value for this table has an observed significance p = 0.15; therefore,
we do not reject the null hypothesis of equal behaviour of male and female students
at the 5% level.
Since one of the variables, SEX, is nominal, we can determine the association
measures suitable to nominal variables, as we did in section 2.3.6. In this example
the phi and uncertainty coefficients both have significances (0.15 and 0.08,
respectively) that do not support the rejection of the null hypothesis (no association
between the variables) at the 5% level.
Table 5.12. Contingency table obtained with SPSS for the SEX and Q7_12
variables of the freshmen dataset. Q7_12 is created with the SPSS recode
command, using Q7. Note that three missing cases are not included.
Q7_12 Total
3 4 5 12
SEX male Count 18 36 29 12 95
Expected Count 14.0 36.8 30.9 13.3 95.0
female Count 1 14 13 6 34
Expected Count 5.0 13.2 11.1 4.7 34.0
Total Count 19 50 42 18 129
Expected Count 19.0 50.0 42.0 18.0 129.0
5.2.3 The Chi-Square Test of Independence
When performing tests of hypotheses one often faces the situation in which a
decision must be made as to whether or not two or more variables pertaining to the
same population can be considered independent. In order to assess the
independency of two variables we use the contingency table formalism, which
now, however, is applied to only one population whose variables can be
categorised into two or more categories. The variables can either be discrete