
Page 219 - Applied Statistics Using SPSS, STATISTICA, MATLAB and R
P. 219
200 5 Non-Parametric Tests of Hypotheses
INIT. As a matter of fact, when using INIT alone, the prediction error is
(131 – 121)/131 = 0.076. With the contribution of variable SEX, the prediction
error is the same (5/131 + 5/131). However, since there is a tie in the row modes,
the contribution of INIT is computed as half of the previous error.
In order to test the significance of the κ statistic measuring the agreement
among several variables, the following statistic, approximately normally
distributed for large n with zero mean and unit standard deviation, is used:
z = κ / var () κ , with 5.28
2
[ EP
( 2
2 P () (2E − κ − 3 ) ( )] + κ − ) 2 ∑ p 3 j
var κ . 5.28a
() ≈
κ ( n κ 1 ) − [ − ()]1 P E 2
As described in 2.3.6.3, the κ statistic can be computed with function kappa
implemented in MATLAB or R; kappa(x,alpha) computes for a matrix x ,
(formatted as columns N, S and P in Table 2.13), the row vector denoted
[ko,z,zc] in MATLAB containing the observed value of κ, ko , the z value of
formula 5.28 and the respective critical value, zc , at alph a level. The meaning of
the returned values for the R kappa function is the same. The results of the κ
statistic significance for Example 2.11 are obtained as shown below. We see that
the null hypothesis (disagreement among all four classifiers) is rejected at a 5%
level of significance, since z > zc .
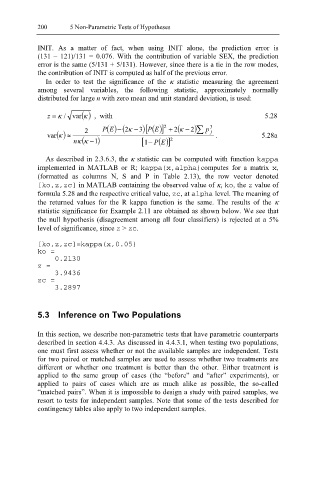
[ko,z,zc]=kappa(x,0.05)
ko =
0.2130
z =
3.9436
zc =
3.2897
5.3 Inference on Two Populations
In this section, we describe non-parametric tests that have parametric counterparts
described in section 4.4.3. As discussed in 4.4.3.1, when testing two populations,
one must first assess whether or not the available samples are independent. Tests
for two paired or matched samples are used to assess whether two treatments are
different or whether one treatment is better than the other. Either treatment is
applied to the same group of cases (the “before” and “after” experiments), or
applied to pairs of cases which are as much alike as possible, the so-called
“matched pairs”. When it is impossible to design a study with paired samples, we
resort to tests for independent samples. Note that some of the tests described for
contingency tables also apply to two independent samples.