
Page 217 - Applied Statistics Using SPSS, STATISTICA, MATLAB and R
P. 217
198 5 Non-Parametric Tests of Hypotheses
hypotheses in a two-sided test concerning any measure of association γ are
formalised as:
H 0: γ = 0;
H 1: γ ≠ 0.
5.2.4.1 Measures for Ordinal Data
Let X and Y denote the variables whose association is being assessed. The exact
values of the sampling distribution of the Spearman’s rank correlation, when H 0 is
true, can be derived if we note that for any given ranking of Y, any rank order of X
is equally likely, and vice-versa. Therefore, any particular ranking has a probability
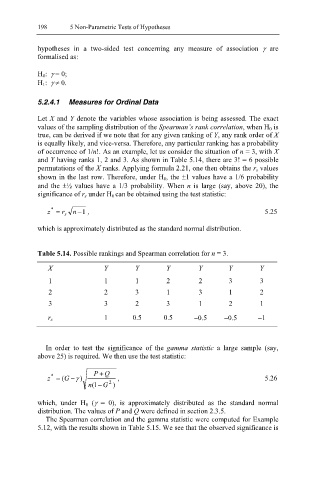
of occurrence of 1/n!. As an example, let us consider the situation of n = 3, with X
and Y having ranks 1, 2 and 3. As shown in Table 5.14, there are 3! = 6 possible
permutations of the X ranks. Applying formula 2.21, one then obtains the r s values
shown in the last row. Therefore, under H 0, the ±1 values have a 1/6 probability
and the ±½ values have a 1/3 probability. When n is large (say, above 20), the
significance of r s under H 0 can be obtained using the test statistic:
z * = r s n − 1 , 5.25
which is approximately distributed as the standard normal distribution.
Table 5.14. Possible rankings and Spearman correlation for n = 3.
X Y Y Y Y Y Y
1 1 1 2 2 3 3
2 2 3 1 3 1 2
3 3 2 3 1 2 1
r s 1 0.5 0.5 −0.5 −0.5 −1
In order to test the significance of the gamma statistic a large sample (say,
above 25) is required. We then use the test statistic:
P + Q
*
z = (G − ) γ , 5.26
1 ( n − G 2 )
which, under H 0 (γ = 0), is approximately distributed as the standard normal
distribution. The values of P and Q were defined in section 2.3.5.
The Spearman correlation and the gamma statistic were computed for Example
5.12, with the results shown in Table 5.15. We see that the observed significance is