
Page 221 - Applied Statistics Using SPSS, STATISTICA, MATLAB and R
P. 221
202 5 Non-Parametric Tests of Hypotheses
Example 5.13
Q: Consider the variable ART, the total area of defects, of the cork-stopper dataset.
Can one assume that the distributions of ART for the first two classes of cork-
stoppers are the same?
A: Variable ART can be considered a continuous variable, and the samples are
independent. Table 5.17 shows the Kolmogorov test results, from where we
conclude that the null hypothesis is rejected, i.e., for variable ART, the first two
classes have different distributions. The test is performed in R with ks.test
(ART[1:50],ART[51:100]) .
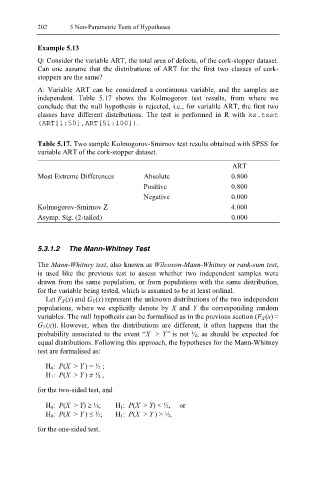
Table 5.17. Two sample Kolmogorov-Smirnov test results obtained with SPSS for
variable ART of the cork-stopper dataset.
ART
Most Extreme Differences Absolute 0.800
Positive 0.800
Negative 0.000
Kolmogorov-Smirnov Z 4.000
Asymp. Sig. (2-tailed) 0.000
5.3.1.2 The Mann-Whitney Test
The Mann-Whitney test, also known as Wilcoxon-Mann-Whitney or rank-sum test,
is used like the previous test to assess whether two independent samples were
drawn from the same population, or from populations with the same distribution,
for the variable being tested, which is assumed to be at least ordinal.
Let F X (x) and G Y (x) represent the unknown distributions of the two independent
populations, where we explicitly denote by X and Y the corresponding random
variables. The null hypothesis can be formalised as in the previous section (F X (x) =
G Y (x)). However, when the distributions are different, it often happens that the
probability associated to the event “X > Y” is not ½, as should be expected for
equal distributions. Following this approach, the hypotheses for the Mann-Whitney
test are formalised as:
H 0: P(X > Y ) = ½ ;
H 1: P(X > Y ) ≠ ½ ,
for the two-sided test, and
H 0: P(X > Y) ≥ ½; H 1: P(X > Y) < ½, or
H 0: P(X > Y ) ≤ ½; H 1: P(X > Y ) > ½,
for the one-sided test.