
Page 224 - Applied Statistics Using SPSS, STATISTICA, MATLAB and R
P. 224
5.3 Inference on Two Populations 205
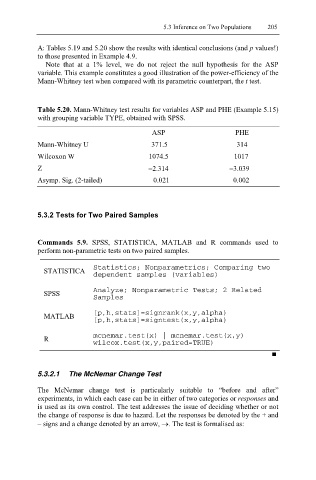
A: Tables 5.19 and 5.20 show the results with identical conclusions (and p values!)
to those presented in Example 4.9.
Note that at a 1% level, we do not reject the null hypothesis for the ASP
variable. This example constitutes a good illustration of the power-efficiency of the
Mann-Whitney test when compared with its parametric counterpart, the t test.
Table 5.20. Mann-Whitney test results for variables ASP and PHE (Example 5.15)
with grouping variable TYPE, obtained with SPSS.
ASP PHE
Mann-Whitney U 371.5 314
Wilcoxon W 1074.5 1017
Z −2.314 −3.039
Asymp. Sig. (2-tailed) 0.021 0.002
5.3.2 Tests for Two Paired Samples
Commands 5.9. SPSS, STATISTICA, MATLAB and R commands used to
perform non-parametric tests on two paired samples.
STATISTICA Statistics; Nonparametrics; Comparing two
dependent samples (variables)
SPSS Analyze; Nonparametric Tests; 2 Related
Samples
MATLAB [p,h,stats]=signrank(x,y,alpha)
[p,h,stats]=signtest(x,y,alpha)
R mcnemar.test(x) | mcnemar.test(x,y)
wilcox.test(x,y,paired=TRUE)
5.3.2.1 The McNemar Change Test
The McNemar change test is particularly suitable to “before and after”
experiments, in which each case can be in either of two categories or responses and
is used as its own control. The test addresses the issue of deciding whether or not
the change of response is due to hazard. Let the responses be denoted by the + and
– signs and a change denoted by an arrow, →. The test is formalised as: