
Page 82 - Applied Statistics Using SPSS, STATISTICA, MATLAB and R
P. 82
2.3 Summarising the Data 61
delimiting 50% of the cases. The large deviation of the 95% percentile from the
upper quartile, when compared to the deviation of the 5% percentile from the lower
quartile, is evidence of a right skewed asymmetrical distribution.
By the linear properties of the mean and the median, we have:
Mean(PRT1) = 0.2 Mean(PRT) + 5 = 147;
Median(PRT1) = 0.2 Median(PRT) + 5 = 131.
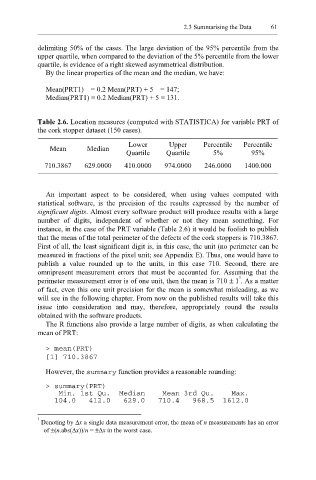
Table 2.6. Location measures (computed with STATISTICA) for variable PRT of
the cork stopper dataset (150 cases).
Lower Upper Percentile Percentile
Mean Median
Quartile Quartile 5% 95%
710.3867 629.0000 410.0000 974.0000 246.0000 1400.000
An important aspect to be considered, when using values computed with
statistical software, is the precision of the results expressed by the number of
significant digits. Almost every software product will produce results with a large
number of digits, independent of whether or not they mean something. For
instance, in the case of the PRT variable (Table 2.6) it would be foolish to publish
that the mean of the total perimeter of the defects of the cork stoppers is 710.3867.
First of all, the least significant digit is, in this case, the unit (no perimeter can be
measured in fractions of the pixel unit; see Appendix E). Thus, one would have to
publish a value rounded up to the units, in this case 710. Second, there are
omnipresent measurement errors that must be accounted for. Assuming that the
3
perimeter measurement error is of one unit, then the mean is 710 ± 1 . As a matter
of fact, even this one unit precision for the mean is somewhat misleading, as we
will see in the following chapter. From now on the published results will take this
issue into consideration and may, therefore, appropriately round the results
obtained with the software products.
The R functions also provide a large number of digits, as when calculating the
mean of PRT:
> mean(PRT)
[1] 710.3867
However, the summary function provides a reasonable rounding:
> summary(PRT)
Min. 1st Qu. Median Mean 3rd Qu. Max.
104.0 412.0 629.0 710.4 968.5 1612.0
3
Denoting by ∆x a single data measurement error, the mean of n measurements has an error
of ±(n.abs(∆x))/n = ±∆x in the worst case.