
Page 86 - Applied Statistics Using SPSS, STATISTICA, MATLAB and R
P. 86
2.3 Summarising the Data 65
Note that:
– For symmetrical distributions, if the mean exists, it will coincide with the
median. Based on this property, one can also measure the skewness using
g = (mean − median)/(standard deviation). It can be proved that –1 ≤ g ≤ 1.
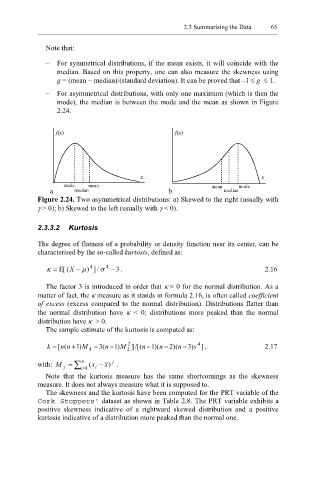
– For asymmetrical distributions, with only one maximum (which is then the
mode), the median is between the mode and the mean as shown in Figure
2.24.
f(x) f(x)
x x
mode mean mean mode
a median b median
Figure 2.24. Two asymmetrical distributions: a) Skewed to the right (usually with
γ > 0); b) Skewed to the left (usually with γ < 0).
2.3.3.2 Kurtosis
The degree of flatness of a probability or density function near its center, can be
characterised by the so-called kurtosis, defined as:
κ = ( [ Ε X − ) µ 4 / ] σ 4 − 3. 2.16
The factor 3 is introduced in order that κ = 0 for the normal distribution. As a
matter of fact, the κ measure as it stands in formula 2.16, is often called coefficient
of excess (excess compared to the normal distribution). Distributions flatter than
the normal distribution have κ < 0; distributions more peaked than the normal
distribution have κ > 0.
The sample estimate of the kurtosis is computed as:
k = [n (n + ) 1 M − ( 3 n − ) 1 M 2 2 ( [ / ] n − 1 )(n − 2 )(n − ) 3 s 4 ] , 2.17
4
j
with: M j = ∑ n = i 1 x ( i − x) .
Note that the kurtosis measure has the same shortcomings as the skewness
measure. It does not always measure what it is supposed to.
The skewness and the kurtosis have been computed for the PRT variable of the
Cork Stoppers’ dataset as shown in Table 2.8. The PRT variable exhibits a
positive skewness indicative of a rightward skewed distribution and a positive
kurtosis indicative of a distribution more peaked than the normal one.