Page 91 - Applied Statistics Using SPSS, STATISTICA, MATLAB and R
P. 91

70       2 Presenting and Summarising the Data


                     6∑ n  d  2
              r s  = 1−  1 = i  i  ,                                       2.21
                     N (N  2  −  ) 1

              When tied ranks occur − i.e., two or more cases receive the same rank on the
           same variable −, each of those cases is assigned the average of the ranks that would
           have  been assigned had no  ties occurred. When the proportion of tied ranks is
           small, formula 2.21 can still be used. Otherwise, the following correction factor is
           computed:

                  g
              T  = ∑  t (  i 3  −t ) ,
                         i
                  = i 1

           where g is the number of groupings of different tied ranks and t i is the number of
           tied ranks in the ith grouping. The Spearman’s rank correlation with correction for
           tied ranks is now written as:

                                       2
                         3
                              )
                       ( N −  N − 6 ∑ n  d − ( T + T )  2 /
              r =1 −               i=1  i  x   y      ,                    2.22
               s
                                          3
                        3
                                               )
                      ( N −  N) 2  − ( T + T )( N −  N + T x T y
                                      y
                                  x

           where T x and T y are the correction factors for the variables X and Y, respectively.


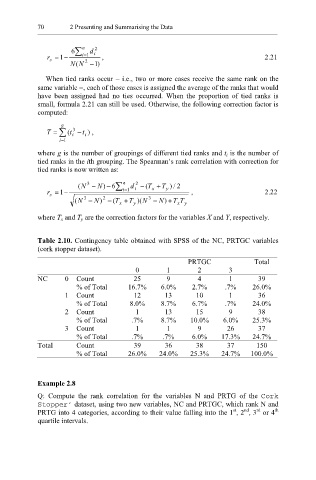
           Table 2.10. Contingency table obtained with SPSS of the NC, PRTGC variables
           (cork stopper dataset).
                                                     PRTGC              Total
                                       0       1        2        3
           NC      0  Count           25       9        4        1       39
                       % of Total    16.7%    6.0%    2.7%     .7%     26.0%
                   1  Count           12       13      10        1       36
                       % of Total    8.0%     8.7%    6.7%      .7%    24.0%
                   2  Count            1       13      15        9       38
                       % of Total     .7%     8.7%    10.0%    6.0%    25.3%
                   3  Count            1       1        9       26       37
                       % of Total     .7%     .7%     6.0%    17.3%    24.7%
           Total      Count           39       36      38       37      150
                       % of Total    26.0%   24.0%    25.3%    24.7%   100.0%


           Example 2.8
           Q: Compute the  rank correlation  for the  variables  N and PRTG  of the  Cork
           Stopper’ dataset, using two new variables, NC and PRTGC, which rank N and
                                                                     nd
                                                                  st
                                                                        rd
                                                                             th
           PRTG into 4 categories, according to their value falling into the 1 , 2 , 3  or 4
           quartile intervals.
   86   87   88   89   90   91   92   93   94   95   96