Page 89 - Applied Statistics Using SPSS, STATISTICA, MATLAB and R
P. 89

68       2 Presenting and Summarising the Data


              In multivariate problems, concerning datasets described by n random variables,
           X 1, X 2, …, X  n, one sometimes needs to assess what is the degree of association of
           two variables, say X 1 and X 2, under the hypothesis that they are linearly estimated
           by the remaining n – 2 variables. For this purpose, the correlation  ρ X 1 X 2  is defined
           in terms of the marginal distributions of X 1 or X 2 given the other variables, and is
           then called the partial correlation of X 1 and X 2 given the other variables. Details on
           partial correlations will be postponed to Chapter 7.


               1.35                              0.12
                  y                                 y
               1.30                              0.10
               1.25                              0.08
               1.20                              0.06
               1.15                              0.04
               1.10                              0.02
               1.05                              0.00
               1.00                              -0.02
                                      x                                   x
             a   0.95 -0.2  0.0  0.2  0.4  0.6  0.8  1.0  1.2  b  -0.04 -0.2  0.0  0.2  0.4  0.6  0.8  1.0  1.2
               1.2                               1.2
                 y                                  y
               1.0                               1.0
               0.8                               0.8
               0.6                               0.6
               0.4                               0.4
               0.2                               0.2
               0.0                               0.0
                                      x                                  x
             c   -0.2 -0.2  0.0  0.2  0.4  0.6  0.8  1.0  1.2  d  -0.2 1.0  1.2  1.4  1.6  1.8  2.0  2.2  2.4
               1.2
                 y                                  y
                                                 0.24
               1.0
                                                 0.20
               0.8
                                                 0.16
               0.6
                                                 0.12
               0.4
                                                 0.08
               0.2
                                                 0.04
               0.0
                                      x          0.00                    x
             e   -0.2 -0.2  0.0  0.2  0.4  0.6  0.8  1.0  1.2  f  -0.2  0.0  0.2  0.4  0.6  0.8  1.0  1.2
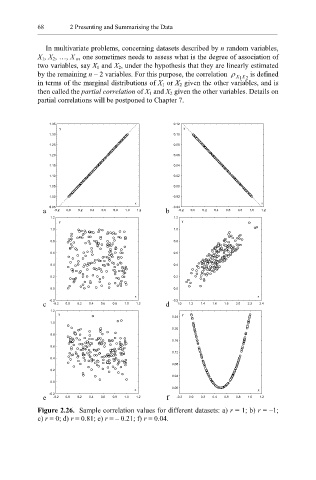
           Figure 2.26.  Sample correlation values for different datasets: a) r = 1; b) r = –1;
           c) r = 0; d) r = 0.81; e) r = – 0.21; f) r = 0.04.
   84   85   86   87   88   89   90   91   92   93   94