
Page 85 - Applied Statistics Using SPSS, STATISTICA, MATLAB and R
P. 85
64 2 Presenting and Summarising the Data
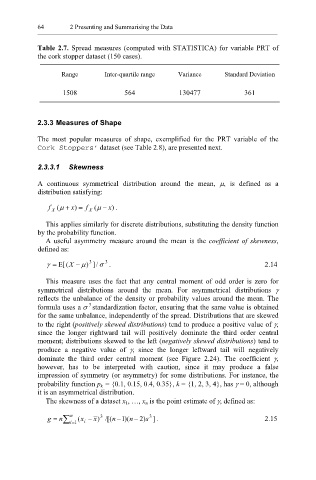
Table 2.7. Spread measures (computed with STATISTICA) for variable PRT of
the cork stopper dataset (150 cases).
Range Inter-quartile range Variance Standard Deviation
1508 564 130477 361
2.3.3 Measures of Shape
The most popular measures of shape, exemplified for the PRT variable of the
Cork Stoppers’ dataset (see Table 2.8), are presented next.
2.3.3.1 Skewness
A continuous symmetrical distribution around the mean, µ, is defined as a
distribution satisfying:
µ
µ
f X ( + ) x = f X ( − ) x .
This applies similarly for discrete distributions, substituting the density function
by the probability function.
A useful asymmetry measure around the mean is the coefficient of skewness,
defined as:
3
γ = ( [ Ε X − ) µ 3 / ] σ . 2.14
This measure uses the fact that any central moment of odd order is zero for
symmetrical distributions around the mean. For asymmetrical distributions γ
reflects the unbalance of the density or probability values around the mean. The
formula uses a σ 3 standardization factor, ensuring that the same value is obtained
for the same unbalance, independently of the spread. Distributions that are skewed
to the right (positively skewed distributions) tend to produce a positive value of γ,
since the longer rightward tail will positively dominate the third order central
moment; distributions skewed to the left (negatively skewed distributions) tend to
produce a negative value of γ, since the longer leftward tail will negatively
dominate the third order central moment (see Figure 2.24). The coefficient γ,
however, has to be interpreted with caution, since it may produce a false
impression of symmetry (or asymmetry) for some distributions. For instance, the
probability function p k = {0.1, 0.15, 0.4, 0.35}, k = {1, 2, 3, 4}, has γ = 0, although
it is an asymmetrical distribution.
The skewness of a dataset x 1, …, x n is the point estimate of γ, defined as:
3
2
1
g = n ∑ n = i 1 x ( i − x) 3 n ( [ / − )( n − ) s ] . 2.15