
Page 208 - Assurance of Sterility for Sensitive Combination Products and Materials
P. 208
Risk to the patient—Quantifying assurance of sterility 187
Yes
Yes
No
No
(A) (B)
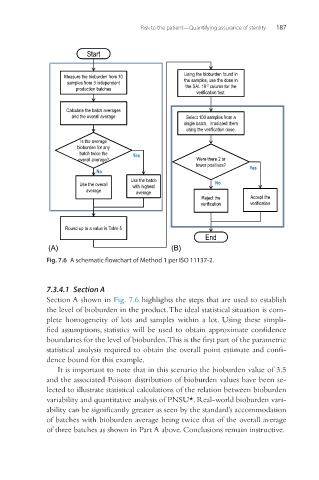
Fig. 7.6 A schematic flowchart of Method 1 per ISO 11137-2.
7.3.4.1 Section A
Section A shown in Fig. 7.6 highlights the steps that are used to establish
the level of bioburden in the product. The ideal statistical situation is com-
plete homogeneity of lots and samples within a lot. Using these simpli-
fied assumptions, statistics will be used to obtain approximate confidence
boundaries for the level of bioburden. This is the first part of the parametric
statistical analysis required to obtain the overall point estimate and confi-
dence bound for this example.
It is important to note that in this scenario the bioburden value of 3.5
and the associated Poisson distribution of bioburden values have been se-
lected to illustrate statistical calculations of the relation between bioburden
variability and quantitative analysis of PNSU*. Real-world bioburden vari-
ability can be significantly greater as seen by the standard’s accommodation
of batches with bioburden average being twice that of the overall average
of three batches as shown in Part A above. Conclusions remain instructive.