
Page 211 - Assurance of Sterility for Sensitive Combination Products and Materials
P. 211
190 Assurance of sterility for sensitive combination products and materials
the x-axis. At 1% defective, the probability of acceptance is 5%. This value is
shown with a red dot. The probability of detection (1 minus the probability
of acceptance) is 95%. This plan provides a 95% confidence of detecting a
batch that is 1% defective or worse. Non-sterile samples can be considered
defective. Note that passing this plan every time, having a high probability
of acceptance, requires a very low fraction defective.
The Method 1 verification test in Section B (Fig. 7.6) is a sampling plan.
100 samples are taken, processed such that the expected probability that any
−2
unit contains a microorganism is one in a hundred, or has a PNSU* of 10 .
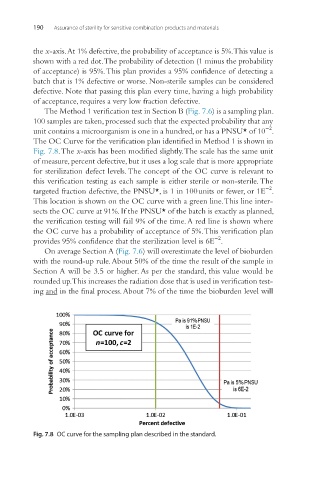
The OC Curve for the verification plan identified in Method 1 is shown in
Fig. 7.8. The x-axis has been modified slightly. The scale has the same unit
of measure, percent defective, but it uses a log scale that is more appropriate
for sterilization defect levels. The concept of the OC curve is relevant to
this verification testing as each sample is either sterile or non-sterile. The
−2
targeted fraction defective, the PNSU*, is 1 in 100 units or fewer, or 1E .
This location is shown on the OC curve with a green line. This line inter-
sects the OC curve at 91%. If the PNSU* of the batch is exactly as planned,
the verification testing will fail 9% of the time. A red line is shown where
the OC curve has a probability of acceptance of 5%. This verification plan
−2
provides 95% confidence that the sterilization level is 6E .
On average Section A (Fig. 7.6) will overestimate the level of bioburden
with the round-up rule. About 50% of the time the result of the sample in
Section A will be 3.5 or higher. As per the standard, this value would be
rounded up. This increases the radiation dose that is used in verification test-
ing and in the final process. About 7% of the time the bioburden level will
Fig. 7.8 OC curve for the sampling plan described in the standard.