
Page 210 - Assurance of Sterility for Sensitive Combination Products and Materials
P. 210
Risk to the patient—Quantifying assurance of sterility 189
and 50% of the time a bioburden level of 4 or higher will be used, to iden-
tify the radiation dose for the verification run when the true level is 3.5.
7.3.4.2 Section B
The analysis in Section A established that a sampling error might result
in misidentifying the average bioburden a modest fraction of the time
for bioburden estimates below the average value and 50% of the time for
bioburden estimates above the average. Section B will provide illustrative
statistical analysis for the underestimate of bioburden.
For Method 1, the verification testing is intended to demonstrate the
−2
selected level of radiation will result in a 10 PNSU*. This demonstration
supports the identification of a radiation dose designed to achieve a selected
−6
PNSU*, most often a 10 PNSU*. The next step of the analysis related
to the ISO 11137-2 components shown in Section B (Fig. 7.6) will use
operational characteristic curves (OCC or OC curves) to determine if the
verification tests prescribed in the standard would detect the error in the
estimate of the bioburden level.
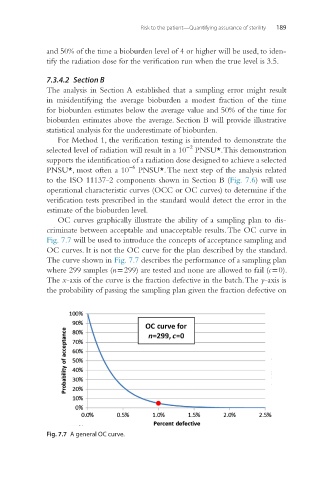
OC curves graphically illustrate the ability of a sampling plan to dis-
criminate between acceptable and unacceptable results. The OC curve in
Fig. 7.7 will be used to introduce the concepts of acceptance sampling and
OC curves. It is not the OC curve for the plan described by the standard.
The curve shown in Fig. 7.7 describes the performance of a sampling plan
where 299 samples (n = 299) are tested and none are allowed to fail (c = 0).
The x-axis of the curve is the fraction defective in the batch. The y-axis is
the probability of passing the sampling plan given the fraction defective on
Fig. 7.7 A general OC curve.