
Page 209 - Assurance of Sterility for Sensitive Combination Products and Materials
P. 209
188 Assurance of sterility for sensitive combination products and materials
As noted above (see Section 7.3.1), the distribution of microbes is as-
sumed to be described by the Poisson distribution. Approximate confidence
intervals for Poisson distributions are provided by Eq. (7.4). The lower con-
fidence bound (LCB) is used as the illustrative worst-case scenario in this
analysis and z-alpha is the quantile of a normal distribution evaluated at the
defined alpha level, lambda is the mean of the Poisson process and n is the
number of samples used to establish the mean. Alpha represents the percent
of the samples when this result is expected to occur.
LCB = Z α × λ n (7.4)
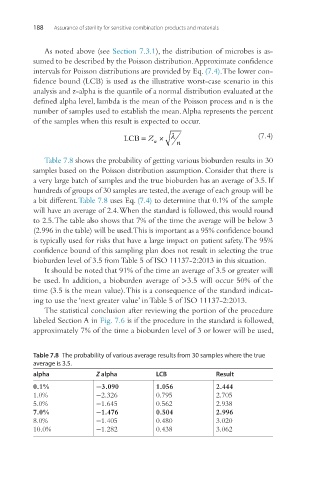
Table 7.8 shows the probability of getting various bioburden results in 30
samples based on the Poisson distribution assumption. Consider that there is
a very large batch of samples and the true bioburden has an average of 3.5. If
hundreds of groups of 30 samples are tested, the average of each group will be
a bit different. Table 7.8 uses Eq. (7.4) to determine that 0.1% of the sample
will have an average of 2.4. When the standard is followed, this would round
to 2.5. The table also shows that 7% of the time the average will be below 3
(2.996 in the table) will be used. This is important as a 95% confidence bound
is typically used for risks that have a large impact on patient safety. The 95%
confidence bound of this sampling plan does not result in selecting the true
bioburden level of 3.5 from Table 5 of ISO 11137-2:2013 in this situation.
It should be noted that 91% of the time an average of 3.5 or greater will
be used. In addition, a bioburden average of >3.5 will occur 50% of the
time (3.5 is the mean value). This is a consequence of the standard indicat-
ing to use the ‘next greater value’ in Table 5 of ISO 11137-2:2013.
The statistical conclusion after reviewing the portion of the procedure
labeled Section A in Fig. 7.6 is if the procedure in the standard is followed,
approximately 7% of the time a bioburden level of 3 or lower will be used,
Table 7.8 The probability of various average results from 30 samples where the true
average is 3.5.
alpha Z alpha LCB Result
0.1% −3.090 1.056 2.444
1.0% −2.326 0.795 2.705
5.0% −1.645 0.562 2.938
7.0% −1.476 0.504 2.996
8.0% −1.405 0.480 3.020
10.0% −1.282 0.438 3.062