
Page 326 - Automotive Engineering Powertrain Chassis System and Vehicle Body
P. 326
Tyre characteristics and vehicle handling and stability C HAPTER 11.1
force is defined to be positive in the upward direction F x ¼ C Fk k
and thus equal to the normal load of the tyre. Also U F y ¼ C Fa a þ C Fg g (11.1.5)
(not provided with a y subscript) is defined positive M z ¼ C Ma a þ C Mg g
with respect to the negative y axis. Note, that the
axes system is in accordance with SAE standards (SAE These equations have been arranged in such a way that
J670e 1976). The sign of the slip angle, however, is all the coefficients (the force and moment slip and
chosen opposite with respect to the SAE definition. camber stiffnesses) become positive quantities.
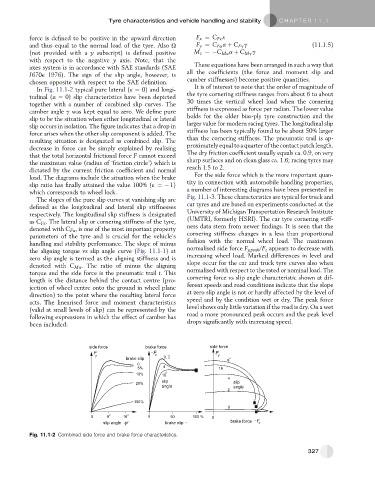
In Fig. 11.1-2 typical pure lateral (k ¼ 0) and longi- It is of interest to note that the order of magnitude of
tudinal (a ¼ 0) slip characteristics have been depicted the tyre cornering stiffness ranges from about 6 to about
together with a number of combined slip curves. The 30 times the vertical wheel load when the cornering
camber angle g was kept equal to zero. We define pure stiffness is expressed as force per radian. The lower value
slip to be the situation when either longitudinal or lateral holds for the older bias-ply tyre construction and the
slip occurs in isolation. The figure indicates that a drop in larger value for modern racing tyres. The longitudinal slip
force arises when the other slip component is added. The stiffness has been typically found to be about 50% larger
resulting situation is designated as combined slip. The than the cornering stiffness. The pneumatic trail is ap-
decrease in force can be simply explained by realising proximately equal to a quarter of the contact patch length.
that the total horizontal frictional force F cannot exceed The dry friction coefficient usually equals ca. 0.9, on very
the maximum value (radius of ‘friction circle’) which is sharp surfaces and on clean glass ca. 1.6; racing tyres may
dictated by the current friction coefficient and normal reach 1.5 to 2.
load. The diagrams include the situation when the brake For the side force which is the more important quan-
slip ratio has finally attained the value 100% (k ¼ 1) tity in connection with automobile handling properties,
which corresponds to wheel lock. a number of interesting diagrams have been presented in
The slopes of the pure slip curves at vanishing slip are Fig. 11.1-3. These characteristics are typical for truck and
defined as the longitudinal and lateral slip stiffnesses car tyres and are based on experiments conducted at the
respectively. The longitudinal slip stiffness is designated University of Michigan Transportation Research Institute
as C Fk . The lateral slip or cornering stiffness of the tyre, (UMTRI, formerly HSRI). The car tyre cornering stiff-
denoted with C Fa , is one of the most important property ness data stem from newer findings. It is seen that the
parameters of the tyre and is crucial for the vehicle’s cornering stiffness changes in a less than proportional
handling and stability performance. The slope of minus fashion with the normal wheel load. The maximum
the aligning torque vs slip angle curve (Fig. 11.1-1)at normalised side force F y,peak /F z appears to decrease with
zero slip angle is termed as the aligning stiffness and is increasing wheel load. Marked differences in level and
denoted with C Ma . The ratio of minus the aligning slope occur for the car and truck tyre curves also when
torque and the side force is the pneumatic trail t. This normalised with respect to the rated or nominal load. The
length is the distance behind the contact centre (pro- cornering force vs slip angle characteristic shown at dif-
jection of wheel centre onto the ground in wheel plane ferent speeds and road conditions indicate that the slope
direction) to the point where the resulting lateral force at zero slip angle is not or hardly affected by the level of
acts. The linearised force and moment characteristics speed and by the condition wet or dry. The peak force
(valid at small levels of slip) can be represented by the level shows only little variation if the road is dry. On a wet
following expressions in which the effect of camber has road a more pronounced peak occurs and the peak level
been included: drops significantly with increasing speed.
Fig. 11.1-2 Combined side force and brake force characteristics.
327