Page 36 - Automotive Engineering Powertrain Chassis System and Vehicle Body
P. 36

CH AP TER 2 .1       Measurement of torque, power, speed and fuel consumption

                                   100%                        100%
                                                   b                                  c
                                                                             b
                                                          c
                                       Torque   a            d     Power   a              d


                                                     e                               e

                                       0         Speed       100%   0        Speed        100%

               Fig. 2.1-13 Engine torque curves plotted on hydraulic dynamometer torque curves.
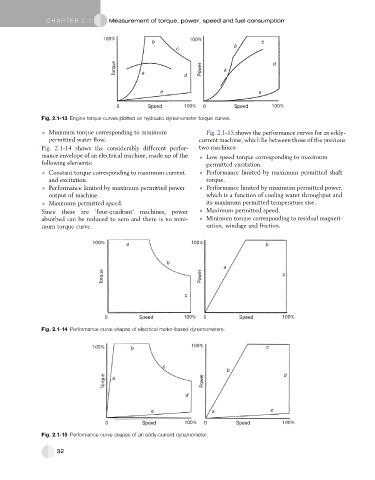
                 Minimum torque corresponding to minimum            Fig. 2.1-15 shows the performance curves for an eddy-
                 permitted water flow.                             current machine, which lie between those of the previous
               Fig. 2.1-14 shows the considerably different perfor-  two machines:
               mance envelope of an electrical machine, made up of the    Low speed torque corresponding to maximum
               following elements:                                  permitted excitation.
                 Constant torque corresponding to maximum current    Performance limited by maximum permitted shaft
                 and excitation.                                    torque.
                 Performance limited by maximum permitted power     Performance limited by maximum permitted power,
                 output of machine.                                 which is a function of cooling water throughput and
                 Maximum permitted speed.                           its maximum permitted temperature rise.
               Since these are ‘four-quadrant’ machines, power      Maximum permitted speed.
               absorbed can be reduced to zero and there is no mini-    Minimum torque corresponding to residual magneti-
               mum torque curve.                                    zation, windage and friction.

                               100%       a                    100%                     b


                                                       b
                                                                          a
                                   Torque                          Power                     c


                                                             c


                                   0          Speed          100%   0          Speed         100%

               Fig. 2.1-14 Performance curve shapes of electrical motor-based dynamometers.

                               100%         b                  100%                     c


                                                      c
                                                                           b                  d
                                   Torque   a                      Power


                                                              d

                                                  e                   a                  e

                                   0           Speed         100%   0         Speed          100%
               Fig. 2.1-15 Performance curve shapes of an eddy-current dynamometer.


                    32
   31   32   33   34   35   36   37   38   39   40   41