
Page 364 - Automotive Engineering Powertrain Chassis System and Vehicle Body
P. 364
Braking systems C HAPTER 12.1
0.5
0.4
Deceleration g 0.3
0.2
0.1
0
2 4 6 8 10 12 14 16
T ime (s)
t 0 t 1 t 2 t 3 t 4 t 5
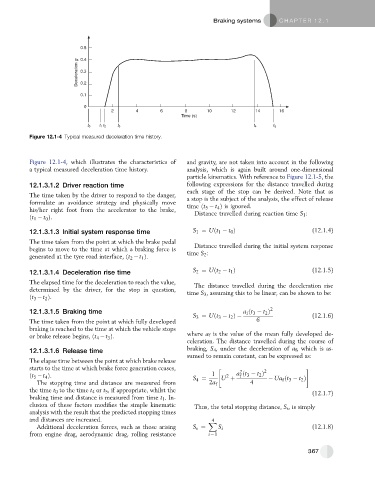
Figure 12.1-4 Typical measured deceleration time history.
Figure 12.1-4, which illustrates the characteristics of and gravity, are not taken into account in the following
a typical measured deceleration time history. analysis, which is again built around one-dimensional
particle kinematics. With reference to Figure 12.1-5, the
12.1.3.1.2 Driver reaction time following expressions for the distance travelled during
each stage of the stop can be derived. Note that as
The time taken by the driver to respond to the danger, a stop is the subject of the analysis, the effect of release
formulate an avoidance strategy and physically move time ðt 5 t Þ is ignored.
4
his/her right foot from the accelerator to the brake, Distance travelled during reaction time S 1 :
ðt 1 t 0 Þ.
12.1.3.1.3 Initial system response time S 1 ¼ Uðt 1 t 0 Þ (12.1.4)
The time taken from the point at which the brake pedal
begins to move to the time at which a braking force is Distance travelled during the initial system response
generated at the tyre road interface, ðt 2 t 1 Þ. time S 2 :
12.1.3.1.4 Deceleration rise time S 2 ¼ Uðt 2 t 1 Þ (12.1.5)
The elapsed time for the deceleration to reach the value, The distance travelled during the deceleration rise
determined by the driver, for the stop in question, time S 3 , assuming this to be linear, can be shown to be:
ðt 3 t 2 Þ.
12.1.3.1.5 Braking time a ðt 3 t 2 Þ 2
f
S 3 ¼ Uðt 3 t 2 Þ (12.1.6)
The time taken from the point at which fully developed 6
braking is reached to the time at which the vehicle stops
or brake release begins, ðt t 3 Þ. where a f is the value of the mean fully developed de-
4
celeration. The distance travelled during the course of
12.1.3.1.6 Release time braking, S 4 , under the deceleration of a f , which is as-
sumed to remain constant, can be expressed as:
The elapse time between the point at which brake release
starts to the time at which brake force generation ceases, " 2 2 #
ðt 5 t Þ. S ¼ 1 U þ a ðt 3 t 2 Þ Ua ðt 3 t 2 Þ
2
f
4
The stopping time and distance are measured from 4 2a f 4 f
the time t 0 to the time t 4 or t 5 , if appropriate, whilst the (12.1.7)
braking time and distance is measured from time t 1 . In-
clusion of these factors modifies the simple kinematic Thus, the total stopping distance, S s , is simply
analysis with the result that the predicted stopping times
and distances are increased. X
4
Additional deceleration forces, such as those arising S s ¼ S i (12.1.8)
from engine drag, aerodynamic drag, rolling resistance i ¼ 1
367