
Page 746 - Automotive Engineering Powertrain Chassis System and Vehicle Body
P. 746
Exterior noise: Assessment and control C HAPTER 22.1
net cancellation of the dynamic pressure is to have this case this is due to flow reversal in the intake valve
two waves travelling in opposite directions, in anti- caused by the particular timing of IVO.
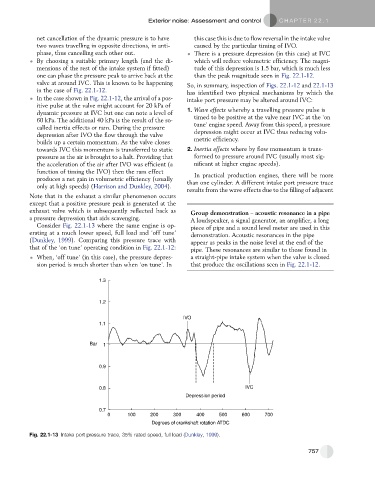
phase, thus cancelling each other out. There is a pressure depression (in this case) at IVC
By choosing a suitable primary length (and the di- which will reduce volumetric efficiency. The magni-
mensions of the rest of the intake system if fitted) tude of this depression is 1.5 bar, which is much less
one can phase the pressure peak to arrive back at the than the peak magnitude seen in Fig. 22.1-12.
valve at around IVC. This is known to be happening
So, in summary, inspection of Figs. 22.1-12 and 22.1-13
in the case of Fig. 22.1-12.
has identified two physical mechanisms by which the
In the case shown in Fig. 22.1-12, the arrival of a pos- intake port pressure may be altered around IVC:
itive pulse at the valve might account for 20 kPa of
1. Wave effects whereby a travelling pressure pulse is
dynamic pressure at IVC but one can note a level of
60 kPa. The additional 40 kPa is the result of the so- timed to be positive at the valve near IVC at the ‘on
called inertia effects or ram. During the pressure tune’ engine speed. Away from this speed, a pressure
depression after IVO the flow through the valve depression might occur at IVC thus reducing volu-
builds up a certain momentum. As the valve closes metric efficiency.
towards IVC this momentum is transferred to static 2. Inertia effects where by flow momentum is trans-
pressure as the air is brought to a halt. Providing that formed to pressure around IVC (usually most sig-
the acceleration of the air after IVO was efficient (a nificant at higher engine speeds).
function of timing the IVO) then the ram effect In practical production engines, there will be more
produces a net gain in volumetric efficiency (usually than one cylinder. A different intake port pressure trace
only at high speeds) (Harrison and Dunkley, 2004).
results from the wave effects due to the filling of adjacent
Note that in the exhaust a similar phenomenon occurs
except that a positive pressure peak is generated at the
exhaust valve which is subsequently reflected back as Group demonstration – acoustic resonance in a pipe
a pressure depression that aids scavenging. A loudspeaker, a signal generator, an amplifier, a long
Consider Fig. 22.1-13 where the same engine is op- piece of pipe and a sound level meter are used in this
erating at a much lower speed, full load and ‘off tune’
demonstration. Acoustic resonances in the pipe
(Dunkley, 1999). Comparing this pressure trace with
appear as peaks in the noise level at the end of the
that of the ‘on tune’ operating condition in Fig. 22.1-12: pipe. These resonances are similar to those found in
When, ‘off tune’ (in this case), the pressure depres- a straight-pipe intake system when the valve is closed
sion period is much shorter than when ‘on tune’. In that produce the oscillations seen in Fig. 22.1-12.
1.3
1.2
IVO
1.1
Bar 1
0.9
0.8 IVC
Depression period
0.7
0 100 200 300 400 500 600 700
Degrees of crankshaft rotation ATDC
Fig. 22.1-13 Intake port pressure trace, 35% rated speed, full load (Dunkley, 1999).
757