Page 301 - Autonomous Mobile Robots
P. 301

288                                    Autonomous Mobile Robots

                                   The auxiliary signal u d is chosen as


                                                       u d1    −k u1 z 1 + h(Z 2 , t)
                                                 u d =     =
                                                       u d2   −ρ 1 z 2 u d1 − k u2 z 3
                                where h(Z 2 , t) is chosen as

                                                                    2
                                                                2
                                                      h(Z 2 , t) = (z + z ) sin t
                                                                2
                                                                    3
                                It is easy to see that the selected h(Z 2 , t) satisfies Assumption 7.3.
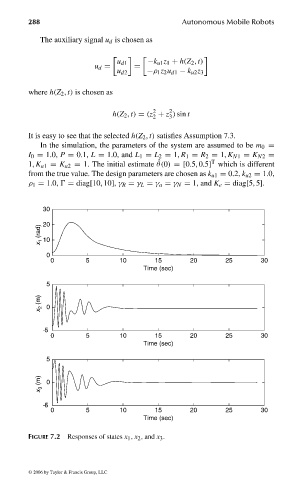
                                   In the simulation, the parameters of the system are assumed to be m 0 =
                                I 0 = 1.0, P = 0.1, L = 1.0, and L 1 = L 2 = 1, R 1 = R 2 = 1, K N1 = K N2 =
                                                                               T
                                1, K a1 = K a2 = 1. The initial estimate ˆ θ(0) =[0.5, 0.5] which is different
                                from the true value. The design parameters are chosen as k u1 = 0.2, k u2 = 1.0,
                                ρ 1 = 1.0,   = diag[10, 10], γ R = γ L = γ a = γ N = 1, and K e = diag[5, 5].


                                    30

                                   x 1  (rad)  20
                                    10
                                     0
                                      0        5        10      15       20       25       30
                                                              Time (sec)

                                     5
                                   x 2  (m)  0


                                    –5
                                      0        5        10      15       20       25       30
                                                              Time (sec)

                                     5

                                   x 3  (m)  0


                                    –5
                                      0        5        10      15       20       25       30
                                                              Time (sec)

                                FIGURE 7.2  Responses of states x 1 , x 2 , and x 3 .


                                 © 2006 by Taylor & Francis Group, LLC


                                FRANKL: “dk6033_c007” — 2006/3/31 — 16:43 — page 288 — #22
   296   297   298   299   300   301   302   303   304   305   306