
Page 327 - Autonomous Mobile Robots
P. 327
Unified Control Design for Autonomous Vehicle 315
15
10
y (m) 5
Leading
p= 0.5
0
p=1
p=2
p=3
–5
–10 0 10 20 30 40 50 60
x (m)
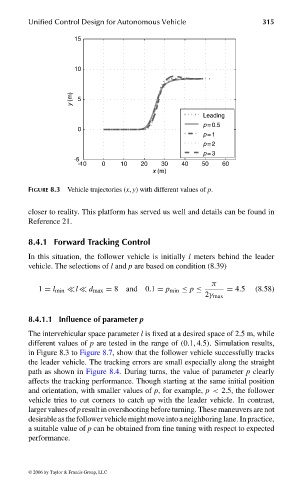
FIGURE 8.3 Vehicle trajectories (x, y) with different values of p.
closer to reality. This platform has served us well and details can be found in
Reference 21.
8.4.1 Forward Tracking Control
In this situation, the follower vehicle is initially l meters behind the leader
vehicle. The selections of l and p are based on condition (8.39)
π
1 = l min l d max = 8 and 0.1 = p min ≤ p ≤ = 4.5 (8.58)
2γ max
8.4.1.1 Influence of parameter p
The intervehicular space parameter l is fixed at a desired space of 2.5 m, while
different values of p are tested in the range of (0.1, 4.5). Simulation results,
in Figure 8.3 to Figure 8.7, show that the follower vehicle successfully tracks
the leader vehicle. The tracking errors are small especially along the straight
path as shown in Figure 8.4. During turns, the value of parameter p clearly
affects the tracking performance. Though starting at the same initial position
and orientation, with smaller values of p, for example, p < 2.5, the follower
vehicle tries to cut corners to catch up with the leader vehicle. In contrast,
larger values of p result in overshooting before turning. These maneuvers are not
desirable asthe followervehicle might move into a neighboring lane. In practice,
a suitable value of p can be obtained from fine tuning with respect to expected
performance.
© 2006 by Taylor & Francis Group, LLC
FRANKL: “dk6033_c008” — 2006/3/31 — 16:43 — page 315 — #21