
Page 330 - Autonomous Mobile Robots
P. 330
318 Autonomous Mobile Robots
15
10
y (m) 5
Leading
l=1 m
0
l=2.5 m
l=4 m
l=5.5 m
– 5
– 10 0 10 20 30 40 50 60
x (m)
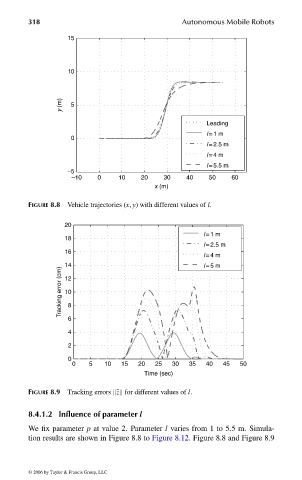
FIGURE 8.8 Vehicle trajectories (x, y) with different values of l.
20
l=1 m
18
l=2.5 m
16
l=4 m
14 l=5 m
Tracking error (cm) 12
10
8
6
4
2
0
0 5 10 15 20 25 30 35 40 45 50
Time (sec)
FIGURE 8.9 Tracking errors ˜z for different values of l.
8.4.1.2 Influence of parameter l
We fix parameter p at value 2. Parameter l varies from 1 to 5.5 m. Simula-
tion results are shown in Figure 8.8 to Figure 8.12. Figure 8.8 and Figure 8.9
© 2006 by Taylor & Francis Group, LLC
FRANKL: “dk6033_c008” — 2006/3/31 — 16:43 — page 318 — #24