Page 328 - Autonomous Mobile Robots
P. 328

316                                    Autonomous Mobile Robots

                                           20
                                                                              p= 0.5
                                           18
                                                                              p=1
                                           16
                                                                              p=2
                                           14                                 p=3
                                          Tracking error (cm)  10
                                           12


                                            8
                                            6
                                            4
                                            2
                                            0
                                             0   5   10  15  20  25  30  35  40  45  50
                                                              Time (sec)

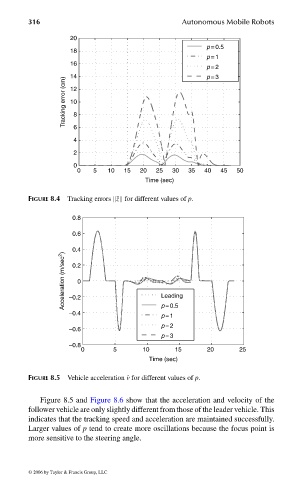
                                FIGURE 8.4 Tracking errors  ˜z  for different values of p.

                                            0.8

                                            0.6
                                            0.4
                                         Acceleration (m/sec 2 )  0.2  Leading


                                             0

                                           – 0.2
                                           – 0.4                  p= 0.5
                                                                  p=1
                                                                  p=2
                                           – 0.6
                                                                  p=3
                                           – 0.8
                                              0       5      10       15      20      25
                                                               Time (sec)
                                FIGURE 8.5  Vehicle acceleration ˙v for different values of p.


                                   Figure 8.5 and Figure 8.6 show that the acceleration and velocity of the
                                follower vehicle are only slightly different from those of the leader vehicle. This
                                indicates that the tracking speed and acceleration are maintained successfully.
                                Larger values of p tend to create more oscillations because the focus point is
                                more sensitive to the steering angle.


                                 © 2006 by Taylor & Francis Group, LLC


                                FRANKL: “dk6033_c008” — 2006/3/31 — 16:43 — page 316 — #22
   323   324   325   326   327   328   329   330   331   332   333