
Page 333 - Autonomous Mobile Robots
P. 333
Unified Control Design for Autonomous Vehicle 321
5
0
y (m) – 5
Leading
p=– 0.5
– 10
p=– 1
p=– 2
p=– 3
– 15
– 60 – 50 – 40 – 30 – 20 – 10 0 10
x (m)
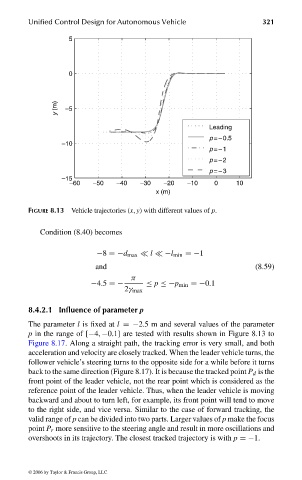
FIGURE 8.13 Vehicle trajectories (x, y) with different values of p.
Condition (8.40) becomes
−8 =−d max l −l min =−1
and (8.59)
π
−4.5 =− ≤ p ≤−p min =−0.1
2γ max
8.4.2.1 Influence of parameter p
The parameter l is fixed at l =−2.5 m and several values of the parameter
p in the range of [−4, −0.1] are tested with results shown in Figure 8.13 to
Figure 8.17. Along a straight path, the tracking error is very small, and both
acceleration and velocity are closely tracked. When the leader vehicle turns, the
follower vehicle’s steering turns to the opposite side for a while before it turns
back to the same direction (Figure 8.17). It is because the tracked point P d is the
front point of the leader vehicle, not the rear point which is considered as the
reference point of the leader vehicle. Thus, when the leader vehicle is moving
backward and about to turn left, for example, its front point will tend to move
to the right side, and vice versa. Similar to the case of forward tracking, the
valid range of p can be divided into two parts. Larger values of p make the focus
point P r more sensitive to the steering angle and result in more oscillations and
overshoots in its trajectory. The closest tracked trajectory is with p =−1.
© 2006 by Taylor & Francis Group, LLC
FRANKL: “dk6033_c008” — 2006/3/31 — 16:43 — page 321 — #27