Page 173 - Basics of MATLAB and Beyond
P. 173

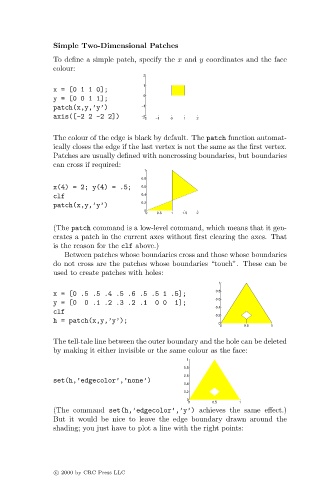
Simple Two-Dimensional Patches
                               To define a simple patch, specify the x and y coordinates and the face
                               colour:
                                                       2
                                                       1
                               x=[0110];
                                                       0
                               y=[0011];
                               patch(x,y,’y’)          −1
                               axis([-2 2 -2 2])       −2 −2  −1  0  1  2

                               The colour of the edge is black by default. The patch function automat-
                               ically closes the edge if the last vertex is not the same as the first vertex.
                               Patches are usually defined with noncrossing boundaries, but boundaries
                               can cross if required:
                                                       1
                                                       0.8
                               x(4) = 2; y(4) = .5;    0.6
                               clf                     0.4
                                                       0.2
                               patch(x,y,’y’)
                                                       0
                                                        0  0.5  1  1.5  2
                               (The patch command is a low-level command, which means that it gen-
                               erates a patch in the current axes without first clearing the axes. That
                               is the reason for the clf above.)
                                  Between patches whose boundaries cross and those whose boundaries
                               do not cross are the patches whose boundaries “touch”. These can be
                               used to create patches with holes:
                                                                           1
                                                                          0.8
                               x = [0 .5 .5 .4 .5 .6 .5 .5 1 .5];
                                                                          0.6
                               y = [0  0 .1 .2 .3.2 .1    0 0  1];
                                                                          0.4
                               clf
                                                                          0.2
                               h = patch(x,y,’y’);
                                                                           0
                                                                           0      0.5    1
                               The tell-tale line between the outer boundary and the hole can be deleted
                               by making it either invisible or the same colour as the face:
                                                                   1
                                                                  0.8
                                                                  0.6
                               set(h,’edgecolor’,’none’)
                                                                  0.4
                                                                  0.2
                                                                   0
                                                                   0     0.5     1
                               (The command set(h,’edgecolor’,’y’) achieves the same effect.)
                               But it would be nice to leave the edge boundary drawn around the
                               shading; you just have to plot a line with the right points:


                               c   2000 by CRC Press LLC
   168   169   170   171   172   173   174   175   176   177   178