Page 178 - Basics of MATLAB and Beyond
P. 178

fac2=[126
                                       163
                                       146
                                       1 6 5];

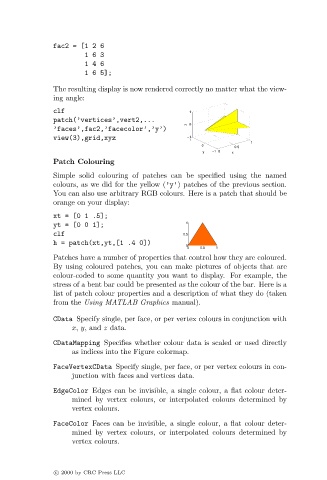
                               The resulting display is now rendered correctly no matter what the view-
                               ing angle:

                               clf                                 1
                               patch(’vertices’,vert2,...
                                                                   z  0
                               ’faces’,fac2,’facecolor’,’y’)
                               view(3),grid,xyz                    −1 1
                                                                                    1
                                                                       0       0.5
                                                                       y  −1  0  x
                               Patch Colouring
                               Simple solid colouring of patches can be specified using the named
                               colours, as we did for the yellow (’y’) patches of the previous section.
                               You can also use arbitrary RGB colours. Here is a patch that should be
                               orange on your display:
                               xt = [0 1 .5];
                               yt=[001];                          1
                               clf                                0.5
                               h = patch(xt,yt,[1 .4 0])
                                                                  0
                                                                   0  0.5  1
                               Patches have a number of properties that control how they are coloured.
                               By using coloured patches, you can make pictures of objects that are
                               colour-coded to some quantity you want to display. For example, the
                               stress of a bent bar could be presented as the colour of the bar. Here is a
                               list of patch colour properties and a description of what they do (taken
                               from the Using MATLAB Graphics manual).

                               CData Specify single, per face, or per vertex colours in conjunction with
                                    x, y, and z data.
                               CDataMapping Specifies whether colour data is scaled or used directly
                                    as indices into the Figure colormap.
                               FaceVertexCData Specify single, per face, or per vertex colours in con-
                                    junction with faces and vertices data.
                               EdgeColor Edges can be invisible, a single colour, a flat colour deter-
                                    mined by vertex colours, or interpolated colours determined by
                                    vertex colours.

                               FaceColor Faces can be invisible, a single colour, a flat colour deter-
                                    mined by vertex colours, or interpolated colours determined by
                                    vertex colours.


                               c   2000 by CRC Press LLC
   173   174   175   176   177   178   179   180   181   182   183