Page 182 - Basics of MATLAB and Beyond
P. 182

N = 20;
                               dt = 2*pi/N;
                               t = 0:dt:(N-1)*dt;
                               x = [cos(t) cos(t)];
                               y = [sin(t) sin(t)];
                               z = [zeros(size(t)) ones(size(t))];

                               The matrix of vertices is
                               vert = [x’ y’ z’];
                               The matrix of faces must be defined so that each row gives, in order, the
                               indices of the vertices that we want to join. The first face is formed by
                               joining the vertices 1,N +1,N + 2 and 2; the second face is formed by
                               joining the vertices 2,N +2,N + 3 and 3; and so on. The faces matrix
                               therefore must have the form:
                                                                           
                                                   1     N +1    N +2    2
                                                   2     N +2    N +3    3
                                                                           
                                                                           
                                                   .       .       .
                                                   .       .       .     .  .
                                                                        . 
                                                  .       .       .     .
                                                                           
                                                 N − 1   2N − 1   2N     N
                                                                           
                                                   N      2N     N +1    1
                               The faces matrix can be defined as follows:
                               faces = [1:N; N+1:2*N; [N+2:2*N N+1]; [2:N 1]]’;
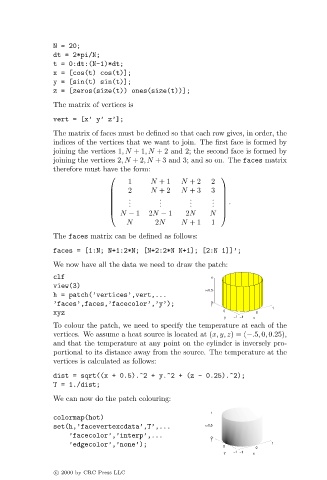
                               We now have all the data we need to draw the patch:
                               clf                                       1
                               view(3)
                                                                        z  0.5
                               h = patch(’vertices’,vert,...
                               ’faces’,faces,’facecolor’,’y’);           1 0
                                                                                         1
                               xyz                                          0        0
                                                                             y  −1  −1  x
                               To colour the patch, we need to specify the temperature at each of the
                               vertices. We assume a heat source is located at (x, y, z)=(−.5, 0, 0.25),
                               and that the temperature at any point on the cylinder is inversely pro-
                               portional to its distance away from the source. The temperature at the
                               vertices is calculated as follows:

                               dist = sqrt((x + 0.5).^2 + y.^2 + (z - 0.25).^2);
                               T = 1./dist;
                               We can now do the patch colouring:


                               colormap(hot)
                               set(h,’facevertexcdata’,T’,...
                                   ’facecolor’,’interp’,...
                                   ’edgecolor’,’none’);


                               c   2000 by CRC Press LLC
   177   178   179   180   181   182   183   184   185   186   187