
Page 180 - Basics of MATLAB and Beyond
P. 180
t = linspace(0,2*pi,20);
x = cos(t);
y=t;
z = sin(t);
We will use the vertex-and-faces method of specifying the patch. The
vertex and face matrices are
v = [x’ y’ z’];
f = 1:20;
We need a colormap of length 20 to colour our 20 data points:
fvc = summer(20);
We generate a patch whose vertices are coloured according to the matrix
fvc:
clf
h = patch(’Vertices’,v,...
’Faces’,f,...
’FaceVertexCdata’,fvc,...
’FaceColor’,’flat’,...
’EdgeColor’,’flat’,...
’Marker’,’o’,...
’MarkerFaceColor’,’flat’);
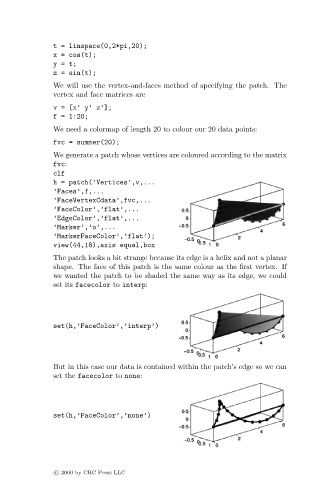
view(44,18),axis equal,box
The patch looks a bit strange because its edge is a helix and not a planar
shape. The face of this patch is the same colour as the first vertex. If
we wanted the patch to be shaded the same way as its edge, we could
set its facecolor to interp:
set(h,’FaceColor’,’interp’)
But in this case our data is contained within the patch’s edge so we can
set the facecolor to none:
set(h,’FaceColor’,’none’)
c 2000 by CRC Press LLC