
Page 183 - Basics of MATLAB and Beyond
P. 183
The colour of each vertex is indexed by the matrix T’ to the colours in
the hot colour map. (The hot spot is coloured dark in this gray scale
version.) Each face of the patch is coloured in a way that interpolates
between the colours of its vertices.
Exercise 22 Can you see what we have done wrong in the above
example? Hint: the patch colouring does not truly represent the
distance away from the heat source. How would you go about
getting a better representation? (Answer on page 193.)
37.2 Light Objects
To create pictures representing real objects, you can colour them as if
they are lit by one or more lights. The lights can be any colour you
like, and the lit objects can have their reflectance properties adjusted
to simulate different surfaces: mirror-like, or self-coloured and shiny, or
dull. Lighting can be applied to surface or patch objects. Light objects
themselves cannot be seen. For the following examples the pltlight
function plots a dot at the position of each light on the graphic. Let us
create a sphere and see what it looks like when lit:
clf
sphere
axis equal
grid,box,xyz
h = light(’position’,[1 -1 1]);
pltlight
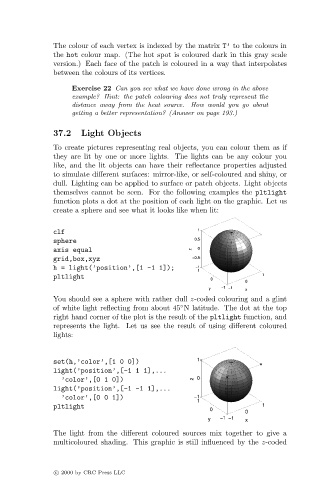
You should see a sphere with rather dull z-coded colouring and a glint
◦
of white light reflecting from about 45 N latitude. The dot at the top
right hand corner of the plot is the result of the pltlight function, and
represents the light. Let us see the result of using different coloured
lights:
set(h,’color’,[1 0 0])
light(’position’,[-1 1 1],...
’color’,[0 1 0])
light(’position’,[-1 -1 1],...
’color’,[0 0 1])
pltlight
The light from the different coloured sources mix together to give a
multicoloured shading. This graphic is still influenced by the z-coded
c 2000 by CRC Press LLC