Page 174 - Basics of MATLAB and Beyond
P. 174

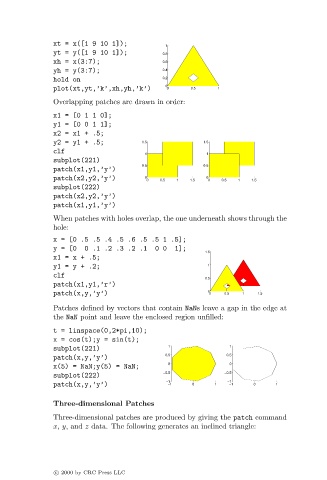
xt = x([1 9 10 1]);           1
                               yt = y([1 9 10 1]);          0.8
                               xh = x(3:7);                 0.6
                               yh = y(3:7);                 0.4
                               hold on                      0.2
                                                             0
                               plot(xt,yt,’k’,xh,yh,’k’)     0      0.5    1
                               Overlapping patches are drawn in order:
                               x1=[0110];
                               y1=[0011];
                               x2=x1+.5;
                               y2=y1+.5;               1.5             1.5
                               clf                     1                1
                               subplot(221)
                                                       0.5             0.5
                               patch(x1,y1,’y’)
                               patch(x2,y2,’y’)        0 0  0.5  1  1.5  0 0  0.5  1  1.5
                               subplot(222)
                               patch(x2,y2,’y’)
                               patch(x1,y1,’y’)
                               When patches with holes overlap, the one underneath shows through the
                               hole:
                               x = [0 .5 .5 .4 .5 .6 .5 .5 1 .5];
                               y = [0  0 .1 .2 .3.2 .1    0 0  1];
                                                                        1.5
                               x1=x+.5;
                               y1=y+.2;                                 1
                               clf
                                                                        0.5
                               patch(x1,y1,’r’)
                               patch(x,y,’y’)                           0 0  0.5  1   1.5
                               Patches defined by vectors that contain NaNs leave a gap in the edge at
                               the NaN point and leave the enclosed region unfilled:
                               t = linspace(0,2*pi,10);
                               x = cos(t);y = sin(t);
                                                              1               1
                               subplot(221)
                                                             0.5             0.5
                               patch(x,y,’y’)
                                                              0               0
                               x(5) = NaN;y(5) = NaN;
                                                            −0.5             −0.5
                               subplot(222)
                                                             −1              −1
                               patch(x,y,’y’)                 −1    0     1   −1    0     1
                               Three-dimensional Patches
                               Three-dimensional patches are produced by giving the patch command
                               x, y, and z data. The following generates an inclined triangle:


                               c   2000 by CRC Press LLC
   169   170   171   172   173   174   175   176   177   178   179