
Page 355 - Battery Reference Book
P. 355
3114 Secondary batteries
31.2 Terminal voltage-discharge time
curves
The voltage characteristics for a cell can be portrayed
as a plot of terminal voltage versus discharge time at
a stipulated discharge rate and battery temperature.
-t
3 1.2
e
31.2.1 Lead-acid batteries F 30 60
I l l I
Typically, sealed lead-acid batteries will deliver sev- 2346 15 50 2 4 6 10 20
eral hundred complete charge/discharge cycles. When
subjected to less than 100% depth of discharge, cycle
life will improve considerably. Depth of discharge is
defined as the percentage of rated capacity removed Figure 31.1 Typical voltage charactistics at various rates of
when discharged under a fixed set of conditions. discharge at 21 "C: Eagle Picher, 1.5V Carefree rechargeable
The nominal capacity of a typical battery when lead-acid battery (Courtesy of Eagle Picher)
discharged to various voltages as a percentage of its
capacity when discharged to 1.75Vlcell is given in sealed batteries. As an example of the use of these
Table 31.1. curves, consider an SLA6-6.4 battery giving 1.5 A for
Figure 31.1 illustrates typical voltage curves of this nominal CZO capacity of 6.4 Ah. Then
type of battery at various rates of discharge.
6.4
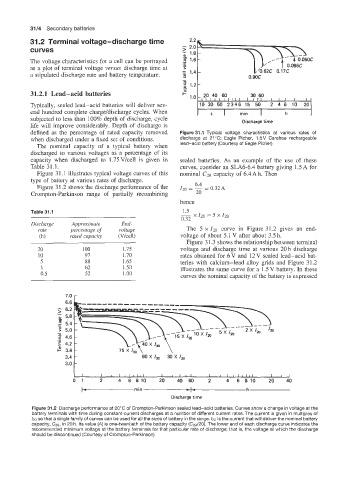
Figure 31.2 shows the discharge performance of the 120 = - = 0.32A
Crompton-Parkinson range of partially recombining 20
hence
x
1.5
Table 31.1 - 120 = 5 x I20
0.32
Discharge Approximate End-
rate percentage of voltage The 5 x 120 curve in Figure 31.2 gives an end-
(h) rated capacity (Vkell) voltage of about 5.1 V after about 3.5 h.
Figure 31.3 shows the relationship between terminal
20 100 1.75 voltage and discharge time at various 20 h discharge
10 97 1.70 rates obtained for 6V and 12V sealed lead-acid bat-
5 88 1.65 teries with calcium-lead alloy grids and Figure 31.2
1 62 1.50 illustrates the same curve for a 1.5 V battery. In these
0.5 52 1.00 curves the nominal capacity of the battery is expressed
6.6
- 6.2
0 5.8
Ul
J
- 5.4
- 5.0
.- 4.6
E 4.2
3.8
3.4
3.0
b-min I- h
Discharge time
Figure 31.2 Discharge performance at 20°C of Crompton-Parkinson sealed lead-acid batteries. Curves show a change in voltage at the
battery terminals with time during constant-current discharges at a number of different current rates. The current is given in multiples of
I20 so that a single family of curves can be used for all the sizes of battery in the range. /20 is the current that will deliver the nominal battery
capacity, C~O, in 20 h. Its value (A) is one-twentieth of the battery capacity (C20/20). The lower end of each discharge curve indicates the
recommended minimum voltage at the battery terminals for that particular rate of discharge; that is, the voltage at which the discharge
should be discontinued (Courtesy of Crompton-Parkinson)